Statistical short forms — full glossary (hover any underlined term in the dashboard for the same definition)
| Short form | Definition |
|---|---|
95% CI | 95% confidence interval. Range that, on repeated sampling, would contain the true parameter value 95% of the time. Wide intervals = more uncertainty. NOT a probability statement about the parameter. |
ANOVA | Analysis of Variance. Parametric test that compares the means of three or more groups by partitioning total variance into between-group and within-group components. |
AUC | Area under the ROC curve. Probability that a randomly chosen positive case scores higher than a randomly chosen negative case. 0.5 = no discrimination; 1.0 = perfect. |
BA | Bland-Altman analysis. Method-comparison analysis (mean of differences vs mean of measurements) used to quantify bias and 95% Limits of Agreement between two measurement methods on the same patients. |
BH | Benjamini-Hochberg procedure. Step-up procedure that orders raw p-values, then accepts as significant those for which i/m × q exceeds p_(i), where m is the number of tests and q is the chosen false-discovery rate. |
BH-FDR | Benjamini-Hochberg FDR. Step-up procedure controlling the False Discovery Rate. Less conservative than Bonferroni; appropriate when many tests are expected to have true effects. |
Bland-Altman | Bland-Altman plot. Method-comparison plot of the difference between two paired measurements (y-axis) against their mean (x-axis). The mean difference (bias) and 95% Limits of Agreement (bias ± 1.96·SD) summarise systematic and random measurement error. |
Bland–Altman | Bland-Altman plot. Method-comparison plot of paired-measurement differences vs mean. Reports bias and 95% Limits of Agreement. |
Brier | Brier score. Mean squared error between predicted probability and observed outcome (0 = perfect, 0.25 = uninformative for a balanced binary outcome). Lower is better. |
Brier score | Brier score. Mean squared error between predicted probability and observed outcome (0 = perfect, 0.25 = uninformative for a balanced binary outcome). Lower is better. |
CI | Confidence interval. Range plausible for the unknown parameter at a stated coverage (usually 95%). Wider with smaller n or higher variance. |
Cohen's κ | Cohen's kappa. Chance-corrected agreement between two binary classifications. |
Cohen's κ | Cohen's kappa. Chance-corrected agreement between two binary classifications. |
Cohen's κ | Cohen's kappa. Chance-corrected agreement between two binary classifications. 1 = perfect agreement; 0 = no better than chance; <0 = worse than chance. >0.80 conventionally interpreted as 'almost perfect' (Landis & Koch, 1977). |
Cohen’s κ | Cohen's kappa. Chance-corrected agreement between two binary classifications. 1 = perfect; 0 = chance; <0 = worse than chance. |
CV | Cross-validation. Resampling procedure: split data into k folds, train on k-1, test on the held-out fold, repeat. Yields an honest estimate of out-of-sample performance and exposes overfitting. |
CV-AUC | Cross-validated area under the ROC curve. Area Under the Receiver Operating Characteristic curve estimated on held-out folds (here 5-fold stratified). Ranges from 0.5 (random) to 1.0 (perfect discrimination). Values <0.65 indicate the model cannot reliably classify new patients. |
CV-AUC < 0.65 | CV-AUC demotion threshold. Threshold below which the engine refuses to call a model deployable. The model still reports OR ± CI as a risk-factor signal, but cannot be used to predict individual patients. |
Deployable | Deployable (model gate). Pre-registered gate: a logistic model is deployable for individual-patient prediction only if 5-fold CV-AUC ≥ 0.65. Below that, it is demoted to risk-factor description. |
DOI | Digital Object Identifier. Persistent globally-unique identifier for digital objects (papers, datasets). Resolves via https://doi.org/<DOI>. |
FDR | False Discovery Rate. Expected proportion of false positives among rejected null hypotheses. Controlled here using the Benjamini-Hochberg step-up procedure across the family of reference-range tests. |
FGF23 | Fibroblast growth factor 23. Bone-derived hormone that regulates phosphate and vitamin D metabolism. Levels are highest in infancy and decline through childhood. |
ICC | Intraclass correlation coefficient. Proportion of total variance attributable to between-cluster variation. Used to assess reliability and to inform clustered analyses. |
ICD-10 | International Classification of Diseases, 10th revision. WHO standard diagnostic code system used for mortality and morbidity reporting. LRTI here = J10–J22. |
IQR | Interquartile range. Range between the 25th and 75th percentiles (Q1 to Q3). A robust spread measure that is insensitive to outliers. |
Kruskal-Wallis | Kruskal-Wallis H test. Non-parametric alternative to one-way ANOVA: tests whether samples from k independent groups originate from the same distribution, using rank sums. |
Kruskal–Wallis | Kruskal-Wallis H test. Non-parametric alternative to one-way ANOVA across k groups, based on rank sums. |
KW | Kruskal-Wallis H test. Rank-based non-parametric alternative to one-way ANOVA. Compares three or more independent groups. |
LoA | Limits of Agreement. 95% Limits of Agreement = bias ± 1.96 × SD of paired differences. Range within which 95% of differences between two paired measurements are expected to fall. |
LRTI | Lower Respiratory Tract Infection. Infection of the airways below the larynx — bronchitis, bronchiolitis, pneumonia. Defined here by ICD-10 codes J10–J22 plus clinical confirmation. |
MAR | Missing At Random. Missingness depends only on observed data. Multiple imputation is appropriate; complete-case may be biased. |
MCAR | Missing Completely At Random. Missingness is unrelated to any observed or unobserved variable. Complete-case analysis is unbiased under MCAR. |
n_events | Number of events. Count of positive outcomes in a binary classification (e.g. patients with hypocalcaemia). Logistic models need ~10 events per predictor for stable coefficient estimates. |
OLS | Ordinary Least Squares regression. Standard linear-regression fit that minimises the sum of squared residuals between observed and predicted y-values. |
OR | Odds ratio. Ratio of the odds of an event occurring in one group vs another. OR = 1 → no association; OR > 1 → event more likely in exposed; OR < 1 → event less likely. Reported with 95% CI. |
p-FDR | FDR-adjusted p-value. p-value after Benjamini-Hochberg correction for multiple testing. Compare directly to your chosen FDR rate (e.g. 0.05). |
p-value | p-value. Probability of observing data at least as extreme as the sample, assuming the null hypothesis is true. Small p → null is incompatible with data. NOT the probability the null is true. Conventional threshold 0.05 is arbitrary. |
Pearson | Pearson correlation. Linear-correlation coefficient (-1 to +1) between two continuous variables, assuming approximate linearity and normality. |
Pearson r | Pearson correlation coefficient. Linear association between two continuous variables. r=1 perfect positive linear; r=0 none; r=-1 perfect negative. Sensitive to outliers; assumes approximate linearity. |
PICU | Paediatric Intensive Care Unit. Hospital unit that provides intensive care for critically ill children. |
PMC | PubMed Central. Free full-text archive of biomedical and life-sciences literature maintained by the U.S. National Library of Medicine. |
PMC OA | PubMed Central Open Access subset. Subset of PubMed Central articles for which full-text content is freely redistributable under an open licence; can be fetched and parsed programmatically. |
PMID | PubMed identifier. Unique numeric identifier assigned by PubMed/MEDLINE to each indexed citation. Persistent and resolvable via https://pubmed.ncbi.nlm.nih.gov/<PMID>/. |
PTH | Parathyroid hormone. Hormone secreted by the parathyroid glands that raises serum calcium by mobilising bone, increasing renal reabsorption, and stimulating vitamin-D-mediated intestinal absorption. |
ROC | Receiver Operating Characteristic curve. Plot of true-positive rate vs false-positive rate across all decision thresholds for a binary classifier. |
R² | Coefficient of determination. Proportion of variance in the dependent variable explained by the regression model. Ranges 0 (no fit) to 1 (perfect). |
SD | Standard deviation. Square root of the variance; spread of values around the mean. Sensitive to outliers and assumes a roughly symmetric distribution. |
SE | Standard error. Standard deviation of an estimator's sampling distribution. Shrinks with √n. Not the same as SD of the data. |
Shapiro-W | Shapiro-Wilk W statistic. Test statistic for the Shapiro-Wilk normality test. W=1 indicates perfect normality; smaller W indicates departure. |
Shapiro-Wilk | Shapiro-Wilk test. Statistical test of the null hypothesis that a sample comes from a normally distributed population. Small p-values reject normality. |
Shapiro–Wilk | Shapiro-Wilk test. Test of normality: small p-values reject the null that a sample is normally distributed. |
Spearman | Spearman rank correlation. Non-parametric rank-based correlation; robust to outliers and non-linear-but-monotonic relationships. |
Spearman ρ | Spearman rank-order correlation. Non-parametric correlation between rank-transformed variables. Captures monotonic (not necessarily linear) association and is robust to outliers. |
STROBE | Strengthening the Reporting of Observational Studies in Epidemiology. International reporting guideline for observational studies (cohort, case-control, cross-sectional). The 22-item checklist helps authors disclose study design, methods, and results transparently. |
Vancouver | Vancouver reference style. Numeric citation style used by the International Committee of Medical Journal Editors (ICMJE) — references are numbered in order of first appearance and listed at the end. |
Wilcoxon | Wilcoxon signed-rank test. Non-parametric one-sample / paired test based on signed ranks of differences from a reference. |
Wilcoxon signed-rank | Wilcoxon signed-rank test. Non-parametric one-sample / paired test of whether the distribution of (paired) differences is symmetric around zero (or a chosen reference value). |
Wilson | Wilson score interval. Confidence interval for a binomial proportion that maintains nominal coverage near 0% and 100%, where the standard normal approximation breaks down. Preferred over the Wald interval. |
Wilson 95% CI | Wilson score interval. 95% confidence interval for a proportion using the Wilson score method (better small-sample / boundary behaviour than the Wald 'normal approximation' interval). |
z-score | z-score (standard score). Number of standard deviations a value lies from the mean: z = (x − mean) / SD. Used here to put total Ca (mg/dL) and ionised Ca (mmol/L) on the same scale before Bland-Altman. |
κ | Cohen's kappa. Chance-corrected agreement between two binary classifications. 1 = perfect; 0 = chance; <0 = worse than chance. |
Headline Findings
7 ranked claims after FDR adjustment and CV-AUC demotion.
Ranked cohort findings after FDR adjustment and CV-AUC demotion. 'High' strength = direct evidence with adequate n + effect size; 'moderate' = adequate but not definitive; 'null' = well-powered failure to find an effect. Single-centre retrospective audit; n=100, no comparator, no outcome variables — interpret accordingly.
Hypocalcemia by total calcium: 25.0% (95% CI 17.5–34.3%, n=25/100).
Evidence: Section D — Wilson 95% CI; threshold = 8.8 mg/dL.
Hypocalcemia by ionized calcium: 26.0% (95% CI 18.4–35.4%, n=26/100).
Evidence: Section D — Wilson 95% CI; threshold = 1.10 mmol/L.
Total–ionized hypocalcemia concordance: Cohen's κ = 0.9737 (almost perfect; observed agreement 0.99).
Evidence: Section D — paired hypocalcemia flags.
Total and ionized calcium correlate Pearson r = 0.7693 (p = 0.0); R² = 0.5918.
Evidence: Section E — Pearson + Spearman + Bland-Altman (z-scored).
ca_ionized_mmol_l: cohort Wilcoxon signed-rank differs from pediatric reference midpoint (p = 0.0, q_FDR = 0.0); 26.0% below reference, 0.0% above.
Evidence: Section C — reference 1.1–1.35 mmol/L.
hypo_total ~ age is NOT clinically deployable: CV-AUC = 0.472 (in-sample 0.5304, optimism 0.0584).
Evidence: Section G — 5-fold CV; cv_auc < 0.65 demotion threshold.
hypo_ionized ~ age is NOT clinically deployable: CV-AUC = 0.5327 (in-sample 0.5372, optimism 0.0044).
Evidence: Section G — 5-fold CV; cv_auc < 0.65 demotion threshold.
🔁 Reproduce: headline-findings ledger (in-browser Python · auto-asserts engine match)
# Reproduce: headline-findings ledger from raw stats output.
hf = _data['headline_findings']
engine_n = hf['n_findings']
items   = hf['findings']
assert len(items) == engine_n, f'count drift {len(items)} vs {engine_n}'
# Each finding must declare rank, category, strength, claim, evidence.
required = {'rank', 'category', 'strength', 'claim', 'evidence'}
for f in items:
    missing = required - set(f.keys())
    assert not missing, f"finding #{f.get('rank','?')} missing keys: {missing}"
ranks = [f['rank'] for f in items]
assert sorted(ranks) == list(range(1, engine_n + 1)), f'rank gaps: {ranks}'
by_strength = {}
for f in items:
    by_strength[f['strength']] = by_strength.get(f['strength'], 0) + 1
print(f'✓ Headline findings: {engine_n} (ranks 1..{engine_n} contiguous)')
for s, n in sorted(by_strength.items()):
    print(f'  - strength={s:8s}: {n} finding(s)')
_data / _rows, recomputes the published number from first principles, and asserts agreement. audit_pipeline.py runs the same cell at build-time — any drift fails the build.🔎 Data Reviewer
Sign-off page. Confirm the cohort, units, thresholds and sample rows before trusting downstream analyses.
1. Schema — what each column means
| Column | Dtype | Unit | Declared use in this analysis |
|---|---|---|---|
patient_id | string | — | row identifier (excluded from analysis) |
age_yrs | float | years | cohort filter (1–5 y) + age stratification + logistic predictor |
ca_total_mg_dl | float | mg/dL | primary outcome: hypocalcaemia at < 8.8 mg/dL |
ca_ionized_mmol_l | float | mmol/L | paired outcome: hypocalcaemia at < 1.10 mmol/L |
diagnosis | string | category | cohort filter (LRTI only) |
2. Sample rows (first 10) — does this look like your data?
| patient_id<br><span class='text-[10px] text-slate-400 font-normal'>—</span> | age_yrs<br><span class='text-[10px] text-slate-400 font-normal'>years</span> | ca_total_mg_dl<br><span class='text-[10px] text-slate-400 font-normal'>mg/dL</span> | ca_ionized_mmol_l<br><span class='text-[10px] text-slate-400 font-normal'>mmol/L</span> | diagnosis<br><span class='text-[10px] text-slate-400 font-normal'>category</span> |
|---|---|---|---|---|
| Patient_1 | 3.3 | 10.44 | 1.25 | LRTI |
| Patient_2 | 3.0 | 10.86 | 1.25 | LRTI |
| Patient_3 | 3.3 | 10.25 | 1.12 | LRTI |
| Patient_4 | 2.8 | 10.53 | 1.29 | LRTI |
| Patient_5 | 2.2 | 7.73 | 0.84 | LRTI |
| Patient_6 | 4.7 | 9.99 | 1.18 | LRTI |
| Patient_7 | 1.3 | 8.7 | 1.05 | LRTI |
| Patient_8 | 4.2 | 10.33 | 1.29 | LRTI |
| Patient_9 | 1.3 | 8.16 | 0.98 | LRTI |
| Patient_10 | 5.0 | 8.31 | 0.85 | LRTI |
Show all 100 rows
| patient_id<br><span class='text-[10px] text-slate-400 font-normal'>—</span> | age_yrs<br><span class='text-[10px] text-slate-400 font-normal'>years</span> | ca_total_mg_dl<br><span class='text-[10px] text-slate-400 font-normal'>mg/dL</span> | ca_ionized_mmol_l<br><span class='text-[10px] text-slate-400 font-normal'>mmol/L</span> | diagnosis<br><span class='text-[10px] text-slate-400 font-normal'>category</span> |
|---|---|---|---|---|
| Patient_1 | 3.3 | 10.44 | 1.25 | LRTI |
| Patient_2 | 3.0 | 10.86 | 1.25 | LRTI |
| Patient_3 | 3.3 | 10.25 | 1.12 | LRTI |
| Patient_4 | 2.8 | 10.53 | 1.29 | LRTI |
| Patient_5 | 2.2 | 7.73 | 0.84 | LRTI |
| Patient_6 | 4.7 | 9.99 | 1.18 | LRTI |
| Patient_7 | 1.3 | 8.7 | 1.05 | LRTI |
| Patient_8 | 4.2 | 10.33 | 1.29 | LRTI |
| Patient_9 | 1.3 | 8.16 | 0.98 | LRTI |
| Patient_10 | 5.0 | 8.31 | 0.85 | LRTI |
| Patient_11 | 2.5 | 9.8 | 1.21 | LRTI |
| Patient_12 | 2.7 | 9.13 | 1.21 | LRTI |
| Patient_13 | 3.1 | 7.29 | 0.94 | LRTI |
| Patient_14 | 1.8 | 9.58 | 1.28 | LRTI |
| Patient_15 | 1.9 | 8.41 | 0.86 | LRTI |
| Patient_16 | 2.3 | 9.19 | 1.26 | LRTI |
| Patient_17 | 3.2 | 9.22 | 1.14 | LRTI |
| Patient_18 | 4.7 | 10.97 | 1.21 | LRTI |
| Patient_19 | 3.2 | 10.81 | 1.1 | LRTI |
| Patient_20 | 3.2 | 8.07 | 0.87 | LRTI |
| Patient_21 | 4.1 | 10.59 | 1.17 | LRTI |
| Patient_22 | 4.1 | 8.14 | 0.94 | LRTI |
| Patient_23 | 1.5 | 9.05 | 1.12 | LRTI |
| Patient_24 | 1.3 | 9.91 | 1.24 | LRTI |
| Patient_25 | 3.5 | 10.76 | 1.15 | LRTI |
| Patient_26 | 4.2 | 6.9 | 1.01 | LRTI |
| Patient_27 | 2.4 | 9.9 | 1.26 | LRTI |
| Patient_28 | 2.4 | 9.05 | 1.18 | LRTI |
| Patient_29 | 1.3 | 9.53 | 1.12 | LRTI |
| Patient_30 | 2.2 | 10.96 | 1.14 | LRTI |
| Patient_31 | 4.1 | 6.88 | 1.01 | LRTI |
| Patient_32 | 1.5 | 10.65 | 1.13 | LRTI |
| Patient_33 | 4.7 | 10.7 | 1.29 | LRTI |
| Patient_34 | 1.5 | 7.51 | 0.83 | LRTI |
| Patient_35 | 4.4 | 10.66 | 1.14 | LRTI |
| Patient_36 | 3.0 | 10.38 | 1.23 | LRTI |
| Patient_37 | 1.8 | 10.47 | 1.27 | LRTI |
| Patient_38 | 2.8 | 9.39 | 1.11 | LRTI |
| Patient_39 | 3.8 | 9.36 | 1.11 | LRTI |
| Patient_40 | 3.8 | 10.41 | 1.24 | LRTI |
| Patient_41 | 4.4 | 9.75 | 1.22 | LRTI |
| Patient_42 | 2.2 | 9.08 | 1.3 | LRTI |
| Patient_43 | 1.9 | 10.12 | 1.18 | LRTI |
| Patient_44 | 1.0 | 7.44 | 0.84 | LRTI |
| Patient_45 | 3.2 | 9.74 | 1.12 | LRTI |
| Patient_46 | 4.9 | 7.3 | 0.96 | LRTI |
| Patient_47 | 1.8 | 7.28 | 0.84 | LRTI |
| Patient_48 | 3.5 | 10.23 | 1.18 | LRTI |
| Patient_49 | 3.5 | 8.39 | 0.8 | LRTI |
| Patient_50 | 2.3 | 9.6 | 1.14 | LRTI |
| Patient_51 | 2.1 | 10.03 | 1.15 | LRTI |
| Patient_52 | 2.4 | 6.63 | 0.91 | LRTI |
| Patient_53 | 3.5 | 8.9 | 1.07 | LRTI |
| Patient_54 | 2.5 | 8.69 | 0.86 | LRTI |
| Patient_55 | 1.6 | 10.5 | 1.19 | LRTI |
| Patient_56 | 2.5 | 10.46 | 1.17 | LRTI |
| Patient_57 | 2.2 | 10.07 | 1.29 | LRTI |
| Patient_58 | 1.8 | 9.73 | 1.15 | LRTI |
| Patient_59 | 4.8 | 10.94 | 1.22 | LRTI |
| Patient_60 | 4.8 | 9.38 | 1.23 | LRTI |
| Patient_61 | 3.1 | 9.16 | 1.24 | LRTI |
| Patient_62 | 3.2 | 7.84 | 1.02 | LRTI |
| Patient_63 | 1.2 | 10.73 | 1.19 | LRTI |
| Patient_64 | 3.4 | 10.02 | 1.17 | LRTI |
| Patient_65 | 2.6 | 10.22 | 1.15 | LRTI |
| Patient_66 | 4.1 | 10.35 | 1.3 | LRTI |
| Patient_67 | 1.2 | 10.79 | 1.15 | LRTI |
| Patient_68 | 4.0 | 10.15 | 1.21 | LRTI |
| Patient_69 | 3.6 | 9.13 | 1.25 | LRTI |
| Patient_70 | 4.9 | 7.27 | 1.04 | LRTI |
| Patient_71 | 1.1 | 10.88 | 1.19 | LRTI |
| Patient_72 | 2.4 | 9.94 | 1.22 | LRTI |
| Patient_73 | 3.1 | 10.59 | 1.25 | LRTI |
| Patient_74 | 4.4 | 6.75 | 0.9 | LRTI |
| Patient_75 | 3.5 | 10.72 | 1.19 | LRTI |
| Patient_76 | 3.7 | 9.58 | 1.15 | LRTI |
| Patient_77 | 2.3 | 9.77 | 1.15 | LRTI |
| Patient_78 | 4.3 | 10.77 | 1.12 | LRTI |
| Patient_79 | 4.7 | 8.02 | 0.82 | LRTI |
| Patient_80 | 1.2 | 9.52 | 1.11 | LRTI |
| Patient_81 | 4.0 | 6.96 | 0.85 | LRTI |
| Patient_82 | 2.2 | 9.66 | 1.14 | LRTI |
| Patient_83 | 1.5 | 8.66 | 0.99 | LRTI |
| Patient_84 | 4.3 | 10.83 | 1.19 | LRTI |
| Patient_85 | 4.3 | 10.99 | 1.23 | LRTI |
| Patient_86 | 2.6 | 10.76 | 1.11 | LRTI |
| Patient_87 | 3.3 | 9.55 | 1.28 | LRTI |
| Patient_88 | 4.1 | 9.33 | 1.26 | LRTI |
| Patient_89 | 4.2 | 9.31 | 1.16 | LRTI |
| Patient_90 | 2.8 | 10.64 | 1.27 | LRTI |
| Patient_91 | 1.1 | 10.24 | 1.28 | LRTI |
| Patient_92 | 1.1 | 10.6 | 1.22 | LRTI |
| Patient_93 | 3.7 | 10.87 | 1.22 | LRTI |
| Patient_94 | 4.9 | 9.28 | 1.16 | LRTI |
| Patient_95 | 3.7 | 10.85 | 1.19 | LRTI |
| Patient_96 | 3.6 | 10.4 | 1.15 | LRTI |
| Patient_97 | 2.6 | 10.57 | 1.29 | LRTI |
| Patient_98 | 2.3 | 10.18 | 1.18 | LRTI |
| Patient_99 | 3.4 | 7.65 | 0.99 | LRTI |
| Patient_100 | 3.2 | 7.25 | 0.99 | LRTI |
3. Cohort filter — what was kept (and what would be excluded)
- Age in
[1, 5]years (observed: 1.0–5.0 y) - Diagnosis ∈ {LRTI} (observed: LRTI (n=100))
- Patients with non-null calcium values for both total AND ionised (observed: n=100/100)
4. Reference ranges — pediatric (1–5 y)
| Variable | Range (lo–hi) | Unit | Midpoint | Source citation |
|---|---|---|---|---|
ca_total_mg_dl | 8.8 – 10.8 | mg/dL | 9.8 | Soldin SJ, Brugnara C, Wong EC. Pediatric Reference Intervals, 7th ed. AACC Press, 2011 — children 1–5y total serum calcium. |
ca_ionized_mmol_l | 1.1 – 1.35 | mmol/L | 1.225 | Greer FR, Tsang RC. Calcium and vitamin D requirements during growth. In: Tsang RC, Lucas A, eds. Nutritional Needs of the Preterm Infant, 1993; pediatric ionized Ca normal range corroborated by NIH MedlinePlus. |
5. Hypocalcaemia thresholds (the cut-offs that drive prevalence)
ca_total_mg_dl< 8.8 mg/dL ⇒ hypocalcaemic (total)ca_ionized_mmol_l< 1.1 mmol/L ⇒ hypocalcaemic (ionised)
Rule: Patient flagged hypocalcemic when value < lower limit of reference range.
6. Age bands (used in age-stratified prevalence + Kruskal-Wallis)
| Label | Lower (≥) | Upper (<) | n in band |
|---|---|---|---|
| 1–<2 y | 1.0 | 2.0 | 22 |
| 2–<3 y | 2.0 | 3.0 | 24 |
| 3–<4 y | 3.0 | 4.0 | 28 |
| 4–5 y | 4.0 | 5.01 | 26 |
7. Sign-off
🔁 Reproduce: cohort shape + completeness from raw rows (in-browser Python · auto-asserts engine match)
# Reproduce: cohort shape + per-column completeness + age range from raw rows.
n_rows_raw = len(_rows)
engine_n   = _data['data_quality']['n_rows']
assert n_rows_raw == engine_n, f'row-count drift: raw={n_rows_raw} engine={engine_n}'
cols_raw = sorted({c for r in _rows for c in r.keys()})
engine_cols = _data['data_quality']['n_cols']
assert len(cols_raw) == engine_cols, f'column-count drift: raw={len(cols_raw)} engine={engine_cols}'
ages = [r['age_yrs'] for r in _rows if r.get('age_yrs') is not None]
age_lo, age_hi = min(ages), max(ages)
eng_age = _data['section_a']['age_range_yrs']
assert abs(age_lo - eng_age['min']) < 1e-6, f'age min drift {age_lo} vs {eng_age["min"]}'
assert abs(age_hi - eng_age['max']) < 1e-6, f'age max drift {age_hi} vs {eng_age["max"]}'
miss_per_col = {c: sum(1 for r in _rows if r.get(c) is None) for c in cols_raw}
n_complete_cols = sum(1 for c, m in miss_per_col.items() if m == 0)
print(f'✓ Cohort: {n_rows_raw} rows × {len(cols_raw)} columns')
print(f'✓ Age range: {age_lo}–{age_hi} y (engine match)')
print(f'✓ Fully-complete columns: {n_complete_cols}/{len(cols_raw)}')
for c in cols_raw:
    print(f'  - {c:25s} missing={miss_per_col[c]}')
_data / _rows, recomputes the published number from first principles, and asserts agreement. audit_pipeline.py runs the same cell at build-time — any drift fails the build.Data Understanding
What's in the dataset, what's missing, and what we can / can't ask.
Cohort overview
- Patients: 100
- Variables: 5
- Age range: 1.0–5.0 y
- Diagnoses: LRTI: n=100
100 pediatric patients (ages 1.0-5.0y), all diagnosed LRTI. 5 variables collected. Single-centre retrospective audit; cross-sectional, no comparator group and no longitudinal follow-up — analyses are descriptive and association-only.
Completeness audit
| Column | Dtype | n non-null | n missing | % complete |
|---|---|---|---|---|
| patient_id | object | 100 | 0 | 100.0% |
| age_yrs | float64 | 100 | 0 | 100.0% |
| ca_total_mg_dl | float64 | 100 | 0 | 100.0% |
| ca_ionized_mmol_l | float64 | 100 | 0 | 100.0% |
| diagnosis | object | 100 | 0 | 100.0% |
Missingness summary
All variables in the LRTI dataset are 100% complete in this audit; no imputation was required. Completeness here reflects only the five fields captured — pre-analytical variables (albumin, pH, sample handling) are absent and would normally be expected in a clinical chemistry workup.
Columns 100% complete: 100.0%
Diagnosis distribution
| Diagnosis | n |
|---|---|
| LRTI | 100 |
🔁 Reproduce: completeness + diagnosis distribution (in-browser Python · auto-asserts engine match)
# Reproduce: per-column completeness audit + diagnosis distribution from raw rows.
engine_compl = {r['column']: r for r in _data['section_a']['completeness']}
drift = []
for col, eng in engine_compl.items():
    n_nn = sum(1 for r in _rows if r.get(col) is not None)
    n_mi = len(_rows) - n_nn
    if n_nn != eng['n_nonnull']:
        drift.append((col, 'n_nonnull', n_nn, eng['n_nonnull']))
    if n_mi != eng['n_missing']:
        drift.append((col, 'n_missing', n_mi, eng['n_missing']))
assert not drift, f'completeness drift: {drift}'
diag_eng = _data['section_a']['diagnosis_distribution']
ctx = (_data['data_quality'].get('study_context') or '')[:80]
assert sum(diag_eng.values()) == len(_rows), \
    f'diagnosis total drift: {sum(diag_eng.values())} vs {len(_rows)}'
assert 'LRTI' in diag_eng, f'expected LRTI cohort, got {list(diag_eng)}'
print(f'✓ Per-column completeness matches engine for all {len(engine_compl)} columns')
for col, eng in engine_compl.items():
    nn = eng['n_nonnull']
    mi = eng['n_missing']
    print(f'  - {col:25s} n_nonnull={nn:3d}  n_missing={mi:2d}')
print(f'✓ Diagnosis distribution {diag_eng} (cohort context: {ctx})')
_data / _rows, recomputes the published number from first principles, and asserts agreement. audit_pipeline.py runs the same cell at build-time — any drift fails the build.Descriptive Statistics
Mean, SD, IQR, range, normality (Shapiro-Wilk).
Distribution summary
| Variable | n | Mean | SD | Median | IQR | Range | Skew | Kurtosis | Shapiro p | Normality (α=0.05) |
|---|---|---|---|---|---|---|---|---|---|---|
| age_yrs | 100 | 2.999 | 1.128 | 3.1 | 2.2–4.0 | 1.0–5.0 | -0.04 | -1.06 | 0.0053 | ⚠ non-normal |
| ca_total_mg_dl | 100 | 9.5 | 1.217 | 9.76 | 8.85–10.508 | 6.63–10.99 | -0.79 | -0.48 | 0.0 | ⚠ non-normal |
| ca_ionized_mmol_l | 100 | 1.127 | 0.136 | 1.155 | 1.065–1.222 | 0.8–1.3 | -0.93 | -0.17 | 0.0 | ⚠ non-normal |
Interpretation
Continuous variables summarised with mean (SD), median (IQR), range, skewness, kurtosis, and Shapiro-Wilk normality. p > 0.05 supports a normal distribution; p < 0.05 favours non-parametric tests downstream.
Try it (in-browser Python)
# Reproduce the descriptive stats table from section_b.
# `_data` is the entire results JSON; section_b.variables is
# {var: {n, mean, sd, median, iqr, ..., shapiro_p, normal_at_alpha_05}}.
for var, d in _data['section_b']['variables'].items():
    flag = '✓ normal' if d['normal_at_alpha_05'] else '⚠ non-normal'
    print(f"{var:20s} n={d['n']:3d}  mean={d['mean']:.3f}  "
          f"median={d['median']:.3f}  Shapiro p={d['shapiro_p']:.4f}  {flag}")
Reference-Range Comparisons
Cohort vs published pediatric reference midpoints (one-sample t / Wilcoxon).
Comparison vs reference midpoint
| Variable | Reference | n | In range | Below | Above | Test | p (raw) | q (FDR) | Sig FDR |
|---|---|---|---|---|---|---|---|---|---|
| ca_total_mg_dl | 8.8–10.8 mg/dL | 100 | 65.0% | 25.0% | 10.0% | Wilcoxon signed-rank | 0.216618 | 0.216618 | — |
| ca_ionized_mmol_l | 1.1–1.35 mmol/L | 100 | 74.0% | 26.0% | 0.0% | Wilcoxon signed-rank | 0.0 | 0.0 | ✅ |
assumptions One-sample t-test — Tests whether the mean of one continuous variable equals a fixed reference value.
- Normality of the variable. Engine runs Shapiro-Wilk first; if it fails the engine automatically falls back to Wilcoxon signed-rank.
- Independent observations. One row per patient, no repeated measures in this cohort.
- Continuous outcome. Calcium concentrations in mg/dL or mmol/L — continuous on the relevant range.
If violated → Wilcoxon signed-rank test (non-parametric).
assumptions Wilcoxon signed-rank test — Non-parametric one-sample test on whether the median equals a reference value.
- Independent observations. One row per patient.
- Differences from reference are symmetric. If grossly skewed, prefer the sign test. Visual histograms of (x − reference) shown in the dashboard.
- Continuous (or at least ordinal) measurement. Calcium values are continuous.
If violated → Sign test (drops the symmetry assumption, lower power).
assumptions Benjamini-Hochberg FDR correction — Controls the expected proportion of false positives among rejections across a family of tests.
- Tests are independent or positively correlated. Reference-range comparisons here use partly overlapping variables — BH-FDR is robust under positive dependence.
- Family of tests is pre-specified. Pre-registration would document this; here the family = every reference-range comparison reported in section_c.
If violated → Bonferroni when strict family-wise error control is required (more conservative).
Reference sources
- ca_total_mg_dl: Soldin SJ, Brugnara C, Wong EC. Pediatric Reference Intervals, 7th ed. AACC Press, 2011 — children 1–5y total serum calcium.
- ca_ionized_mmol_l: Greer FR, Tsang RC. Calcium and vitamin D requirements during growth. In: Tsang RC, Lucas A, eds. Nutritional Needs of the Preterm Infant, 1993; pediatric ionized Ca normal range corroborated by NIH MedlinePlus.
Interpretation
Each calcium variable compared to the published pediatric reference midpoint via one-sample t (if normal) or Wilcoxon signed-rank (if not). The in-range / below / above counts describe how the cohort sits against the reference window.
🔁 Reproduce: one-sample tests + BH-FDR (in-browser Python · auto-asserts engine match)
from scipy import stats
import math
# For every variable in section_c, recompute the one-sample test
# (t-test if engine flagged normal, Wilcoxon otherwise) and verify
# the published p-value matches.
for c in _data['section_c']['comparisons']:
    var, mid = c['variable'], c['reference_midpoint']
    vals = [r[var] for r in _rows if var in r]
    test_name = c['test']['test']
    if test_name == 'one-sample t-test':
        stat, p = stats.ttest_1samp(vals, mid)
        engine_stat = c['test']['t_stat']
    else:
        diffs = [v - mid for v in vals]
        stat, p = stats.wilcoxon(diffs)
        engine_stat = c['test']['w_stat']
    p_eng = c['test']['p_value']
    assert abs(p - p_eng) < 1e-3, f'{var}: p drift {p:.4f} vs {p_eng:.4f}'
    assert abs(stat - engine_stat) < 1e-2, f'{var}: stat drift {stat} vs {engine_stat}'
    print(f'✓ {var:20s} {test_name:24s} stat={stat:.4f} p={p:.4f} (engine p={p_eng:.4f})')
# BH-FDR sanity: count of FDR-significant tests
n_sig_fdr = sum(1 for c in _data['section_c']['comparisons'] if c['test'].get('sig_fdr'))
engine_n_sig = _data['section_c']['fdr_summary']['n_sig_fdr']
assert n_sig_fdr == engine_n_sig, f'BH-FDR drift {n_sig_fdr} vs {engine_n_sig}'
print(f'✓ BH-FDR: {n_sig_fdr} of {len(_data["section_c"]["comparisons"])} tests significant after correction')
_data / _rows, recomputes the published number from first principles, and asserts agreement. audit_pipeline.py runs the same cell at build-time — any drift fails the build.Hypocalcaemia Prevalence
Prevalence by total / ionised / either / both definitions, with Wilson 95% CIs.
By total Ca (< 8.8 mg/dL)
25.0%
95% CI 17.5–34.3%, n=25/100
By ionised Ca (< 1.10 mmol/L)
26.0%
95% CI 18.4–35.4%, n=26/100
Either definition
26.0%
95% CI 18.4–35.4%, n=26/100
Both definitions
25.0%
95% CI 17.5–34.3%, n=25/100
assumptions Wilson score 95% CI — Confidence interval for a binomial proportion with good behaviour at the boundaries.
- Binomial sampling. Each patient is independently classified hypo/not-hypo by a fixed threshold.
- n is large enough that boundary effects are mild. Wilson is valid for small n; we still flag bands with n<30 because the CI gets visibly wide.
If violated → Exact Clopper-Pearson interval when conservativeness matters; Jeffreys interval as a middle ground.
Cohen's κ (total vs ionised hypocalcaemia agreement)
κ = 0.974 (almost perfect)
Observed agreement = 0.99; expected by chance = 0.62; n = 100.
assumptions Cohen's kappa — Chance-corrected agreement between two binary classifications.
- Two raters (or methods) classifying the same units. Total-Ca low yes/no vs ionised-Ca low yes/no.
- Categories are mutually exclusive and exhaustive. Hypocalcaemia is dichotomised at a single threshold per method.
- Independent classifications. One pair of measurements per patient.
- Marginals not extremely imbalanced. Very low or very high prevalence inflates κ artefacts (the so-called paradoxes); inspect the cross-tab cell counts above.
If violated → Report observed agreement (po) and prevalence-adjusted bias-adjusted κ (PABAK) when marginals are skewed.
Concordance cross-tab
| Ionised normal | Ionised low | |
|---|---|---|
| Total normal | 74 | 1 |
| Total low | 0 | 25 |
Interpretation
Hypocalcemia by total Ca: 25.0% (95% CI 17.5-34.3%). By ionized Ca: 26.0% (95% CI 18.4-35.4%). Cohen's kappa = 0.9737 (almost perfect).
🔁 Reproduce: prevalence + Wilson CI + Cohen's κ (in-browser Python · auto-asserts engine match)
from statsmodels.stats.proportion import proportion_confint
thr = _data['meta']['config_snapshot']['hypocalcemia_thresholds']
n = len(_rows)
n_low_t = sum(1 for r in _rows if r['ca_total_mg_dl']    < thr['ca_total_mg_dl'])
n_low_i = sum(1 for r in _rows if r['ca_ionized_mmol_l'] < thr['ca_ionized_mmol_l'])
lo_t, hi_t = proportion_confint(n_low_t, n, alpha=0.05, method='wilson')
lo_i, hi_i = proportion_confint(n_low_i, n, alpha=0.05, method='wilson')
eng_t = _data['section_d']['prevalence']['by_total_calcium']
eng_i = _data['section_d']['prevalence']['by_ionized_calcium']
assert n_low_t == eng_t['n_yes'], f'total count drift {n_low_t} vs {eng_t["n_yes"]}'
assert n_low_i == eng_i['n_yes'], f'ionised count drift {n_low_i} vs {eng_i["n_yes"]}'
assert abs(lo_t*100 - eng_t['ci95_pct'][0]) < 0.1, f'total Wilson CI lo drift'
assert abs(hi_t*100 - eng_t['ci95_pct'][1]) < 0.1, f'total Wilson CI hi drift'
print(f'✓ Hypo total:   {n_low_t}/{n} = {n_low_t/n*100:.1f}% (95% Wilson CI {lo_t*100:.1f}-{hi_t*100:.1f}%)')
print(f'✓ Hypo ionised: {n_low_i}/{n} = {n_low_i/n*100:.1f}% (95% Wilson CI {lo_i*100:.1f}-{hi_i*100:.1f}%)')
# Cohen's kappa hand-derivation
h_t = [r['ca_total_mg_dl']    < thr['ca_total_mg_dl']    for r in _rows]
h_i = [r['ca_ionized_mmol_l'] < thr['ca_ionized_mmol_l'] for r in _rows]
po = sum(t == i for t, i in zip(h_t, h_i)) / n
p_t = sum(h_t) / n; p_i = sum(h_i) / n
pe = p_t * p_i + (1 - p_t) * (1 - p_i)
kappa = (po - pe) / (1 - pe)
k_eng = _data['section_d']['concordance_kappa']['kappa']
assert abs(kappa - k_eng) < 1e-3, f'κ drift {kappa:.4f} vs {k_eng:.4f}'
print(f'✓ Cohen\'s κ: po={po:.4f} pe={pe:.4f} κ={kappa:.4f} (engine κ={k_eng:.4f})')
_data / _rows, recomputes the published number from first principles, and asserts agreement. audit_pipeline.py runs the same cell at build-time — any drift fails the build.Total vs Ionised Agreement
Pearson + Spearman + linear regression + Bland-Altman (z-scored).
Correlation
- Pearson r: 0.769 (p = 0.0)
- Spearman ρ: 0.595 (p = 0.0)
- R² (OLS): 0.592
- Linear:
ionized ≈ 0.3081 + 0.086155 × total
assumptions Pearson correlation — Strength of LINEAR association between two continuous variables.
- Linearity. Inspect the scatter plot above — is the cloud cigar-shaped or curved? The engine also reports Spearman ρ as a monotonic-but-not-linear sanity check.
- Bivariate normality (joint, not marginal). n=100 means the sampling distribution of r is approximately normal even with mild deviations; for hypothesis testing this is robust.
- Homoscedasticity. Variance of one variable should not depend on the other. Check the residual cone of the scatter.
- No influential outliers. Pearson r is sensitive; a single point can move r by 0.1+. Spearman ρ provides an outlier-robust comparison.
If violated → Spearman rank correlation (rank-based, robust to outliers and monotone non-linearity).
assumptions Bland-Altman analysis — Quantifies agreement (not correlation) between two paired measurement methods.
- Paired measurements on the same units. Total (mg/dL) and ionised (mmol/L) calcium are on different scales — engine z-scores both before differencing. Consequence: bias = 0 by construction and the LoA describe RANK agreement only.
- Differences are approximately normal. Required for the 1.96·SD rule defining the 95% LoA.
- Variance of differences is constant across the mean. Heteroscedasticity inflates the LoA and may need a log-transform or proportional limits.
If violated → Report a regression-based LoA when variance scales with the magnitude, or fit a mixed-effect model when there are repeats.
Bland–Altman (mg/dL, OLS-inverse projection)
- Bias: 0.0 mg/dL (clinically interpretable units)
- SD of differences: 1.011 mg/dL
- 95% LoA: [-1.981, 1.981] mg/dL
- Outside LoA: 6 (6.0%)
Ionised calcium (mmol/L) projected to mg/dL via OLS-inverse of the total→ionised regression; Bland–Altman computed on (observed_total, predicted_total) pairs.
Bland–Altman (z-scored, secondary)
- Bias: 0.0 (≡ 0 by construction — z-scoring centres both arrays; not a finding)
- 95% LoA: [-1.331, 1.331] (rank-agreement spread, dimensionless)
- Outside LoA: 2 (2.0%)
Secondary analysis. Inputs z-scored before differencing because total (mg/dL) and ionised (mmol/L) are on different scales; the bias is therefore 0 by construction and the LoA describe rank agreement only. Clinically interpretable Bland-Altman in mg/dL is reported in 'bland_altman_mg_dl'.
Scatter plot (total vs ionised)
Bland–Altman plot (z-scored)
Interpretation
Pearson r = 0.7693 (p = 0.0); Spearman ρ = 0.5947. R² = 0.5918. Bland-Altman (mg/dL, OLS-inverse projection): bias = 0.0 mg/dL, 95% LoA = [-1.9814, 1.9814] mg/dL, 6/100 pairs outside.
🔁 Reproduce: Pearson r + Bland-Altman (in-browser Python · auto-asserts engine match)
from scipy import stats
import statistics
tot = [r['ca_total_mg_dl']    for r in _rows]
ion = [r['ca_ionized_mmol_l'] for r in _rows]
r_calc, p_calc = stats.pearsonr(tot, ion)
r_eng = _data['section_e']['pearson_r']
assert abs(r_calc - r_eng) < 1e-3, f'Pearson r drift {r_calc:.4f} vs {r_eng:.4f}'
print(f'✓ Pearson r = {r_calc:.4f} (engine={r_eng:.4f}), p = {p_calc:.4g}')
# Bland-Altman on z-scored values (engine method)
tm, ts = statistics.mean(tot), statistics.stdev(tot)
im, isd = statistics.mean(ion), statistics.stdev(ion)
z_t = [(v - tm) / ts for v in tot]
z_i = [(v - im) / isd for v in ion]
diffs = [a - b for a, b in zip(z_t, z_i)]
bias = statistics.mean(diffs)
sd_d = statistics.stdev(diffs)
loa = (bias - 1.96 * sd_d, bias + 1.96 * sd_d)
ba_eng = _data['section_e']['bland_altman_zscore']
assert abs(bias) < 1e-3, f'BA bias should be ≈0 by construction; got {bias:.4f}'
assert abs(sd_d - ba_eng['sd_of_differences']) < 1e-2, 'BA SD drift'
print(f'✓ BA (z-scored): bias={bias:.4f} (≡0 by construction), SD={sd_d:.4f}, LoA={loa[0]:.4f} to {loa[1]:.4f}')
_data / _rows, recomputes the published number from first principles, and asserts agreement. audit_pipeline.py runs the same cell at build-time — any drift fails the build.Age-Stratified Analysis
Means, SDs and hypocalcaemia rates per age band; Kruskal-Wallis (and ANOVA when n≥5).
By age band
| Band | n | Total Ca mean | SD | Ionised mean | SD | Hypo% (total) | Hypo% (ionised) |
|---|---|---|---|---|---|---|---|
| 1–<2 y | 22 | 9.476 | 1.162 | 1.101 | 0.148 | 31.8% | 31.8% |
| 2–<3 y | 24 | 9.666 | 0.984 | 1.16 | 0.127 | 12.5% | 12.5% |
| 3–<4 y | 28 | 9.597 | 1.156 | 1.131 | 0.122 | 21.4% | 25.0% |
| 4–5 y | 26 | 9.264 | 1.517 | 1.114 | 0.149 | 34.6% | 34.6% |
Cross-band tests
| Test | Statistic | p-value | n groups |
|---|---|---|---|
| ca_total_kruskal_wallis | 0.352 | 0.94988 | 4 |
| ca_total_anova | 0.531 | 0.662363 | — |
| ca_ionized_kruskal_wallis | 2.231 | 0.525934 | 4 |
| ca_ionized_anova | 0.818 | 0.487045 | — |
assumptions Kruskal-Wallis H test — Non-parametric test of whether ≥3 independent groups come from the same distribution.
- Independent samples in each group. Distinct patients per age band.
- Similar shape distributions across groups. If shapes differ, the test detects shape differences — not purely a median shift. Inspect band-wise histograms.
- Outcome at least ordinal. Calcium concentrations are continuous — comfortably ordinal.
If violated → One-way ANOVA when normality and equal-variance hold; Mood's median test when shapes differ markedly.
Interpretation
Age bands (1-<2, 2-<3, 3-<4, 4-5y) compared on mean Ca and hypocalcemia rate. Kruskal-Wallis used (robust to non-normality); ANOVA reported when each band has n>=5.
Per-band hypocalcaemia rate (chart)
Per-band hypocalcaemia % with 95 % Wilson CIs
🔁 Reproduce: per-band stats + Kruskal-Wallis (in-browser Python · auto-asserts engine match)
from scipy import stats
bands = _data['meta']['config_snapshot']['age_bands']
thr = _data['meta']['config_snapshot']['hypocalcemia_thresholds']
groups_total = []
for b in bands:
    grp = [r['ca_total_mg_dl'] for r in _rows if b['lower'] <= r['age_yrs'] < b['upper_exclusive']]
    groups_total.append(grp)
    eng_band = next(x for x in _data['section_f']['by_band'] if x['band'] == b['label'])
    assert len(grp) == eng_band['n'], f"{b['label']}: n drift {len(grp)} vs {eng_band['n']}"
    n_hypo = sum(1 for v in grp if v < thr['ca_total_mg_dl'])
    pct = n_hypo / len(grp) * 100 if grp else 0
    assert abs(pct - eng_band['hypo_total_pct']) < 0.5, f"{b['label']}: hypo% drift"
    print(f"✓ {b['label']}: n={len(grp):3d}  mean={sum(grp)/len(grp):.3f}  hypo={pct:.1f}%")
h_stat, p_kw = stats.kruskal(*groups_total)
kw_eng = _data['section_f']['tests']['ca_total_kruskal_wallis']
assert abs(h_stat - kw_eng['h_stat']) < 1e-2, f'KW H drift {h_stat:.4f} vs {kw_eng["h_stat"]}'
assert abs(p_kw - kw_eng['p_value']) < 1e-3, f'KW p drift {p_kw:.4f} vs {kw_eng["p_value"]}'
print(f'✓ Kruskal-Wallis (total Ca, {kw_eng["n_groups"]} bands): H={h_stat:.4f} p={p_kw:.4f}')
_data / _rows, recomputes the published number from first principles, and asserts agreement. audit_pipeline.py runs the same cell at build-time — any drift fails the build.Logistic Model — Hypocalcaemia ~ Age
Cross-validated AUC, calibration, Brier, Wald-CI odds ratios.
Interpretation
Logistic regression of hypocalcemia (binary) on age (continuous, years). Reported with cross-validated AUC, calibration, and Wald-CI odds ratios.
assumptions Logistic regression — Models the log-odds of a binary outcome as a linear function of predictors.
- Log-odds linear in continuous predictors. Add a quadratic term or a spline of age to test. Engine reports both linear and risk-factor descriptions.
- Independent observations. One row per patient, no clustering.
- No perfect separation. Convergence failure or extreme |β| flag separation. n=25 events with 1 predictor is borderline — events-per-variable rule of thumb is ≥10.
- No important confounders omitted. This is a univariable age model; full multivariable model would also adjust for nutritional status and infection severity if available.
If violated → Penalised logistic (Firth's correction) for separation; mixed-effects logistic for clustered data.
assumptions AUC of the ROC curve — Probability that a random positive case scores higher than a random negative case.
- Outcome is well-defined and binary. Hypocalcaemia at fixed threshold = positive class.
- Predictions are honestly out-of-sample. Engine reports BOTH in-sample AUC and 5-fold CV-AUC. Optimism = in-sample − CV-AUC indicates overfitting.
- Sample large enough for the AUC distribution to be informative. n_events = 25 in this cohort gives a wide AUC CI; interpret with caution.
If violated → Report PR-AUC instead when classes are extremely imbalanced; report calibration alongside discrimination.
hypo_total ~ age
NOT DEPLOYABLE- n = 100; events = 25
- CV-AUC: 0.472 (SD 0.089; folds [0.4267, 0.4133, 0.38, 0.5133, 0.6267])
- In-sample AUC: 0.53; optimism: 0.058
- Brier: 0.19 (no-skill 0.188)
- Calibration intercept / slope: -1.173 / -0.067
| Predictor | β | OR | CI lo | CI hi | p |
|---|---|---|---|---|---|
| age_yrs | 0.095 | 1.099 | 0.733 | 1.648 | 0.646305 |
Demotion reason: 5-fold CV-AUC = 0.472 < 0.65; the model cannot reliably discriminate outcomes on held-out patients.
hypo_ionized ~ age
NOT DEPLOYABLE- n = 100; events = 26
- CV-AUC: 0.533 (SD 0.117; folds [0.4867, 0.3267, 0.64, 0.5733, 0.6369])
- In-sample AUC: 0.537; optimism: 0.004
- Brier: 0.195 (no-skill 0.192)
- Calibration intercept / slope: -1.111 / -0.052
| Predictor | β | OR | CI lo | CI hi | p |
|---|---|---|---|---|---|
| age_yrs | 0.113 | 1.119 | 0.75 | 1.67 | 0.581655 |
Demotion reason: 5-fold CV-AUC = 0.5327 < 0.65; the model cannot reliably discriminate outcomes on held-out patients.
🔁 Reproduce: logistic β, OR, 5-fold CV-AUC + demotion gate (in-browser Python · auto-asserts engine match)
import numpy as np
from sklearn.linear_model import LogisticRegression
from sklearn.model_selection import StratifiedKFold, cross_val_score
thr = _data['meta']['config_snapshot']['hypocalcemia_thresholds']
ages = np.array([r['age_yrs'] for r in _rows]).reshape(-1, 1)
y = np.array([1 if r['ca_total_mg_dl'] < thr['ca_total_mg_dl'] else 0 for r in _rows])
model = LogisticRegression(max_iter=1000)
model.fit(ages, y)
beta = model.coef_[0][0]
OR = np.exp(beta)
eng = _data['section_g']['models']['hypo_total']['coefficients_demoted'][0]
assert abs(beta - eng['beta']) < 1e-2, f'β drift {beta:.4f} vs {eng["beta"]}'
assert abs(OR - eng['or']) < 1e-2, f'OR drift {OR:.4f} vs {eng["or"]}'
print(f'✓ β(age) = {beta:+.4f}  OR = {OR:.4f}  (engine β={eng["beta"]:+.4f}, OR={eng["or"]:.4f})')
# 5-fold stratified CV-AUC with engine's random_state=42
skf = StratifiedKFold(n_splits=5, shuffle=True, random_state=42)
aucs = cross_val_score(model, ages, y, cv=skf, scoring='roc_auc')
cv_auc = float(aucs.mean())
cv_eng = _data['section_g']['models']['hypo_total']['cv_quality']['cv_auc']
assert abs(cv_auc - cv_eng) < 0.02, f'CV-AUC drift {cv_auc:.4f} vs {cv_eng:.4f}'
print(f'✓ 5-fold CV-AUC = {cv_auc:.4f} (engine={cv_eng:.4f})')
print(f'  Demotion gate: CV-AUC < 0.65? {cv_auc < 0.65} → model is NOT deployable')
_data / _rows, recomputes the published number from first principles, and asserts agreement. audit_pipeline.py runs the same cell at build-time — any drift fails the build.Literature review (5 pre-specified questions)
PubMed-derived evidence for each study question; click each card to expand.
Search and screening funnel
| Stage | Description | n |
|---|---|---|
| 1_search | PubMed search (5 questions × 2 queries) | 103 |
| 2_filter | Filter (abstract + year >= 2010) | 102 |
| 3_screen | LLM relevance screen | 102 |
| 4_extract | Detailed extraction (top-N) | 50 |
| 4b_fulltext | PMC OA full-text fetched (top-N) | 25 |
| 5_synthesize | Section-level synthesis | 5 |
Per-question evidence synthesis
Each card answers one of the five pre-specified study questions, with the supporting citations listed.
Hypocalcemia prevalence in pediatric LRTI / pneumonia n_supporting = 13
Contemporary evidence establishes that hypocalcemia is common in pediatric lower respiratory tract infections (LRTI), with a reported prevalence of 44.8% in a cohort of 225 children [PMID:40008601]. Notably, among children with severe pneumonia, the presence of diarrhea—often linked to metabolic acidosis—was associated with higher mortality (20% vs 3%) and a greater frequency of hypocalcemia [PMID:27314825]. Vitamin D insufficiency, defined as 25-hydroxyvitamin D below 70 nmol/L, further heightens the risk of hypocalcemia (p=0.01) and appears to underlie complicated pneumonia courses including empyema [PMID:21465443]. A systematic review underscored that lower vitamin D concentrations are consistently associated with severe and complicated pneumonia [PMID:35000906]. Electrolyte disturbances extend beyond calcium: hypomagnesemia (<0.42 mmol/L) affects 39.6% of hospitalized children and is strongly linked to concurrent hypocalcemia, hyponatremia, and hypokalemia [PMID:35265997]. Even in neonatal early-onset infections, total serum calcium is significantly depressed during the first three days of life (p<0.0001) [PMID:31184301], and relative hypocalcemia has been noted in pediatric patients with SARS-CoV-2 immunoglobulin M positivity [PMID:34151783]. The clinical relevance of calcium dysregulation is suggested by the observation that 30.61% of children with LRTI required mechanical ventilation [PMID:33378060], and experimental animal models of infection show decreased calcium intensity with effective treatment [PMID:23273676].
Despite these associations, the literature harbors significant methodological weaknesses. Many studies are small: only 34 children were enrolled in a key case-control study [PMID:21465443], 29 neonates in a retrospective cohort [PMID:31184301], and some evidence stems from a single case report of an adult with Mycoplasma pneumoniae pneumonia and pancreatitis [PMID:27506562]. Most investigations employ retrospective or observational designs [PMID:40008601, PMID:35265997], which are susceptible to selection bias and unmeasured confounding. Additional data appear only in conference proceedings without detailed pediatric calcium data [PMID:27409075, PMID:27885969] or in editorial commentaries that do not present primary clinical findings [PMID:36773844]. Animal studies, such as a rat model of meningitis, provide mechanistic insight but have limited direct applicability to human pediatric LRTI [PMID:23273676]. Measurement variability further undermines comparability: some studies report total calcium [PMID:31184301], others likely ionized calcium, but timing of sampling relative to disease onset is rarely standardized, and important confounders like magnesium status and vitamin D levels are not consistently captured [PMID:35265997, PMID:21465443]. Consequently, hypocalcemia prevalence fluctuates—44.8% in one report [PMID:40008601] versus a specific subset in diarrheal pneumonia [PMID:27314825]—and no clear dose-response curve links calcium decrements to outcomes like mechanical ventilation or mortality [PMID:33378060]. The role of vitamin D, while biologically plausible through modulation of innate immunity [PMID:21465443], awaits robust interventional data in pediatric LRTI specifically [PMID:35000906].
A small, focused retrospective cohort derived from a pediatric LRTI dashboard can address these shortcomings by providing granular patient-level data from a single center. Unlike small case series [PMID:21465443, PMID:31184301, PMID:27506562] or conference abstracts lacking analyzable datasets [PMID:27409075, PMID:27885969], a dedicated analysis of all LRTI admissions over a defined period—potentially exceeding prior samples—would enable multivariable adjustment for confounders such as magnesium, vitamin D, and illness severity scores. This approach can directly examine whether admission ionized calcium predicts need for mechanical ventilation [PMID:33378060] or mortality, building on the unadjusted observations from diarrheal pneumonia [PMID:27314825] and hypomagnesemia studies [PMID:35265997]. Furthermore, it can test the generalizability of findings from neonatal [PMID:31184301] and COVID-19-specific [PMID:34151783] populations to the broader pediatric LRTI spectrum. While animal models [PMID:23273676] and adult reports [PMID:27506562] offer pathophysiological hints, a retrospective cohort can pragmatically delineate thresholds of hypocalcemia that correlate with adverse outcomes, thereby informing clinical monitoring and future interventional trials. Finally, by situating the findings alongside vitamin D status—a known modifier of respiratory disease severity [PMID:35000906]—and electrolytes like magnesium [PMID:35265997], the study can propose a cohesive metabolic profile for risk stratification in pediatric LRTI, a need that speculative editorials [PMID:36773844] have highlighted but not addressed.
Citations: PMID:PMID:40008601, PMID:PMID:27314825, PMID:PMID:21465443, PMID:PMID:35000906, PMID:PMID:35265997, PMID:PMID:31184301, PMID:PMID:34151783, PMID:PMID:33378060, PMID:PMID:23273676, PMID:PMID:27506562, PMID:PMID:27409075, PMID:PMID:27885969, PMID:PMID:36773844
Pediatric calcium reference ranges (1-5 years) n_supporting = 15
Contemporary pediatric literature establishes that calcium reference intervals are strongly age-dependent, with ionized calcium (iCa) ranging widely in the neonatal period—1.14–1.46 mmol/L at birth to 1.29–1.59 mmol/L by day eight—before narrowing to adult-equivalent concentrations by approximately 2.5 years [PMID:35288108, PMID:40785088]. However, a cross-sectional study found that serum total calcium remained constant from 3 days to 30 months [PMID:36524863]. Large-scale data-mining efforts have yielded robust indirect reference intervals (e.g., KOSMIC method, n=40914, validated against CALIPER) across birth to 18 years [PMID:37702687], while a Chinese cohort (n=12352) demonstrated that most biochemical markers, including calcium, exhibit greater variability between 28 days and 1 year, with sex differences emerging around puberty for some analytes [PMID:35934870]. Harmonized reference intervals for calcium have been recommended and verified across multiple laboratories and manufacturers using big data from community laboratories [PMID:37478022, PMID:40763882]. LMS-based centile charts further confirm active calcium and phosphate accrual during growth spurts [PMID:26126034]. Mineral reference intervals can fluctuate by sex, age, and season; for example, in Chinese children (n=2217), calcium was age-dependent while magnesium and copper showed sex differences, and nine of eleven minerals varied seasonally [PMID:34719383]. Phosphate homeostasis regulators like FGF23 decline with age, with median iFGF23 of 43.0 pg/mL (20.8–81.6) at 2 years and 42.9 pg/mL (20.8–81.5) at 16 years [PMID:41991079], and another study found FGF23 higher in females and correlated with age, weight, and height but not with vitamin D, PTH, or dietary calcium/phosphate [PMID:38146724]. Continuous LMS-based percentiles for phosphate, TmP/GFR, and sKlotho confirm age- and sex-dependent patterns [PMID:37850343]. Electrolyte derangements are common in sick children: in critically ill children (n=154), 39.6% had hypomagnesemia, which was associated with hypocalcemia, hyponatremia, and hypokalemia [PMID:35265997]. Gender-specific differences in lipids and electrolytes, including potassium, phosphate, and chloride, emerge in adolescents [PMID:39431864]. Even age-related improvements in muscle function, which depends on calcium dynamics, have been documented in children [PMID:24658220].
Despite these advances, several methodological weaknesses persist. Many reference interval studies rely on retrospective data mining or cross-sectional designs that may not represent acutely ill populations, such as those with lower respiratory tract infections (LRTI) [PMID:35288108, PMID:36524863, PMID:34719383]. Indirect statistical methods (KOSMIC, Bhattacharya, Hoffman) inherently assume normal population distributions and have shown variable accuracy [PMID:37702687]. Sample sizes range dramatically—from the robust n=40914 [PMID:37702687] to modest cohorts of 81 [PMID:24658220] or 107 [PMID:38146724]—and some studies lacked sample size reporting altogether [PMID:39431864]. Pre-analytical factors for ionized calcium measurement are rarely standardized, potentially introducing variability [PMID:40785088]. Harmonized intervals, while promising, were derived from specific regions (e.g., Canada) and may not be universally applicable to different ethnicities or resource settings [PMID:37478022, PMID:40763882]. Seasonal effects on multiple minerals [PMID:34719383] and the rapid changes in the first 10 days of life [PMID:40785088] underscore the challenge of defining a single reference interval for all ages and conditions. Critically, few studies link calcium or mineral levels to clinical outcomes in LRTI; the hypomagnesemia study noted trends toward higher ventilation and mortality but lacked statistical power [PMID:35265997]. Sex-specific differences remain contentious for calcium itself, with some studies finding effects only in adolescence for other analytes [PMID:35934870, PMID:37850343] while FGF23 studies show sex disparities even in young children [PMID:38146724]. Thus, the literature is fragmented by design, population, and analyte (total vs. ionized calcium), leaving gaps in the clinical utility of existing reference intervals for acutely ill children with LRTI.
A small, focused retrospective cohort like the present one can uniquely address these gaps by linking calcium levels directly to LRTI severity and outcomes in a well-defined pediatric population. Unlike large data-mining studies, such a design permits granular abstraction of clinical variables—such as illness severity, comorbidities, nutritional status, and respiratory support—enabling the investigation of whether ionized or total calcium dysregulation predicts length of stay, mechanical ventilation, or mortality. It can test whether published age-specific intervals, including the harmonized targets [PMID:40763882] and the early-life iCa ranges [PMID:40785088], actually apply to acutely infected children, and whether routine calcium monitoring in LRTI has prognostic value. By incorporating other electrolyte measurements (e.g., magnesium [PMID:35265997], phosphate [PMID:37850343]), it can explore patterns of dyselectrolytemia that may exacerbate respiratory compromise. Although the sample will be limited, rigorous statistical adjustment and hypothesis-driven design allow for a proof-of-concept analysis that may inform prospective studies. Moreover, it can document real-world pre-analytical variability in a busy acute-care setting, a factor rarely addressed in reference interval literature. Ultimately, this study can bridge the gap between population-derived normative data and bedside clinical application in a vulnerable patient group.
Citations: PMID:35288108, PMID:40785088, PMID:36524863, PMID:37702687, PMID:35934870, PMID:37478022, PMID:40763882, PMID:26126034, PMID:34719383, PMID:41991079, PMID:38146724, PMID:37850343, PMID:35265997, PMID:39431864, PMID:24658220
Total vs ionized calcium agreement in pediatric populations n_supporting = 11
In pediatric populations, calcium homeostasis is frequently perturbed by concomitant electrolyte and nutritional deficiencies. Hypomagnesemia, present in 39.6% of critically ill children, is associated with hypocalcemia [PMID:35265997], and vitamin D deficiency affects 28–96% of children across various conditions, including type 1 diabetes, burns, and critical illness [PMID:24824802, PMID:20853194, PMID:27218060]. These disturbances manifest clinically: ionized calcium is significantly lower in convulsing children [PMID:26553087], and total serum calcium declines markedly in neonates with early-onset infection (p < 0.0001) [PMID:31184301]. Cardiac sequelae, including prolonged QTc and reduced ventricular function, correlate strongly with serum calcium in malnourished children [PMID:28895173], whereas in healthy children, muscle performance depends primarily on lean mass and age, with no direct calcium effect demonstrated [PMID:24658220]. Genetic factors further modulate calcium levels; the TT genotype of the vitamin D receptor is associated with higher serum calcium in prepubertal girls [PMID:24415299], and low magnesium, a key cofactor in calcium regulation, is linked to poor glycemic control [PMID:24393429]. Measurement of ionized calcium, the physiologically active fraction, shows acceptable agreement across different direct and indirect ion-selective electrode analyzers [PMID:39349157].
Despite these insights, the evidence base has substantial methodological limitations. Sample sizes are frequently small, ranging from 29 to 216 participants, as seen in studies on neonatal infection [PMID:31184301], malnutrition [PMID:28895173], and convulsive disorders [PMID:26553087], and many are cross-sectional, precluding causal conclusions [PMID:24824802, PMID:20853194, PMID:26553087, PMID:24415299, PMID:24393429]. Associations between vitamin D status and outcomes are inconsistent: while 83% of pediatric ICU deaths occurred in vitamin D-deficient patients, the correlation with PELOD severity scores was not significant (p=0.09) [PMID:24824802]. Similarly, hypermagnesemia showed non-significant trends toward higher ventilation and mortality [PMID:35265997]. No study has directly assessed the agreement between total and ionized calcium in acutely ill children, and analytical variability, although generally acceptable, still exists among different ionized calcium measurement methods [PMID:39349157]. The impact of albumin, pH, and critical illness on the total versus ionized calcium relationship remains largely unexplored in pediatric populations, leaving uncertainty about the clinical reliability of total calcium as a surrogate marker.
A focused retrospective cohort of pediatric patients with lower respiratory tract infection (LRTI) and simultaneous total and ionized calcium measurements can uniquely address these gaps. Such a study would leverage the recognized interactions between infection, calcium dysregulation, and outcomes—total calcium falls in neonatal infection [PMID:31184301], ionized calcium correlates with neurological severity [PMID:26553087], and electrolyte disturbances are common in critical illness [PMID:35265997]—to quantify the agreement between total and ionized calcium in a well-circumscribed acute condition. It could determine whether total calcium, despite its wider availability, reliably reflects the biologically active ionized fraction when albumin, pH, and inflammation are disrupted by LRTI, building on analytical performance data of ionized calcium assays [PMID:39349157]. By associating calcium status with clinical endpoints such as duration of respiratory support, cardiac function [PMID:28895173], or mortality [PMID:24824802], the cohort could provide pragmatic evidence for resource-limited settings, where total calcium measurement is the norm. This focused design would overcome the heterogeneity of previous cross-sectional studies [PMID:20853194, PMID:27218060, PMID:24415299, PMID:24393429], the small sample sizes of earlier cohorts [PMID:31184301, PMID:28895173], and the confounding factors of healthy-child muscle performance that complicate interpretation [PMID:24658220].
Citations: PMID:35265997, PMID:24824802, PMID:28895173, PMID:24658220, PMID:39349157, PMID:31184301, PMID:26553087, PMID:20853194, PMID:27218060, PMID:24415299, PMID:24393429
Clinical significance of hypocalcemia in pediatric infection n_supporting = 11
Contemporary evidence indicates that hypocalcemia is a common electrolyte disturbance in pediatric critical illness, with ionized hypocalcemia documented in 77% of children admitted to the intensive care unit [PMID:23683566]. In severe pneumonia, the presence of diarrhea—often accompanied by metabolic acidosis and hypocalcemia—elevates mortality from 3% to 20% [PMID:27314825]. Vitamin D deficiency, which exacerbates hypocalcemia, is prevalent in pediatric respiratory infections; one study found vitamin D levels below 70 nmol/L in children with pneumonia to be significantly associated with higher rates of hypocalcaemia (p=0.01) and anemia, and two fatalities occurred among subjects with profoundly low 25-hydroxyvitamin D levels [PMID:21465443]. Similarly, another cross-sectional investigation reported vitamin D deficiency in 28% and insufficiency in 47% of critically ill children, with 83% of deaths occurring in those with low vitamin D levels, though the PELOD score correlation was not significant (p=0.09) [PMID:24824802]. Hypocalcemia further acts as an independent risk factor for sepsis-associated encephalopathy (incidence 43.33%, mortality 6.70%), alongside elevated procalcitonin, septic shock, and a higher PELOD-2 score [PMID:35711261]. It is also independently associated with higher organ dysfunction scores (OR 2.24, 95% CI 1.23–4.07) [PMID:23683566], and in malnourished children, serum calcium levels strongly correlate with prolonged QTc and compromised left ventricular function [PMID:28895173]. These data collectively establish hypocalcemia as a marker of severity, even though its direct link to mortality remains debated in some cohorts [PMID:23683566].
Despite these compelling associations, the literature is limited by small sample sizes, with several studies enrolling fewer than 60 participants [PMID:21465443, PMID:28895173, PMID:27727039] and some being single case reports [PMID:31475645]. Methodological heterogeneity—ranging from case-control designs [PMID:21465443] to retrospective chart reviews [PMID:35711261, PMID:31069660] and cross-sectional surveys [PMID:24824802]—impedes pooling of data. The definition and measurement of hypocalcemia vary widely: ionized calcium was used in some PICU cohorts [PMID:23683566], while others relied on total or corrected calcium, leading to discordant findings; for example, a study on posterior reversible encephalopathy syndrome found no association with corrected serum calcium [PMID:31069660]. The relationship between hypocalcemia and mortality remains inconsistent: one prospective study found no independent effect on 10-day mortality despite a strong organ dysfunction association [PMID:23683566], while vitamin D-related hypocalcemia studies showed a clustering of deaths in low vitamin D groups but without robust statistical power [PMID:24824802]. Important confounders, including malnutrition [PMID:28895173, PMID:31475645], acidosis [PMID:27314825], and concomitant medication effects [PMID:35711261], are often incompletely controlled. Furthermore, the broader critical care literature on conditions like colchicine poisoning [PMID:27727039] or therapeutic plasma exchange [PMID:38747186] rarely reports detailed calcium status, and sepsis biomarker research remains an evolving field without unified recommendations [PMID:27885969]. Consequently, the precise role of calcium dysregulation in pediatric LRTI, and whether correction improves outcomes, is unresolved, especially given experimental evidence suggesting that calcium supplementation may exacerbate organ injury [PMID:23683566].
A small, focused retrospective cohort study concentrating exclusively on pediatric lower respiratory tract infections could significantly advance our understanding by minimizing the disease heterogeneity that plagues broader PICU investigations [PMID:23683566]. Such a study could meticulously quantify the prevalence and severity of hypocalcemia in this subgroup, using standardized ionized calcium measurements, while concurrently recording potential modifiers like vitamin D levels [PMID:21465443], nutritional status [PMID:28895173], and acidosis [PMID:27314825]. It could directly test whether hypocalcemia independently predicts meaningful outcomes—such as duration of respiratory support, length of stay, cardiac complications (prolonged QTc) [PMID:28895173], or neurological morbidity like sepsis-associated encephalopathy [PMID:35711261]—by adjusting for established severity scores. In contrast to large trials that may overlook calcium’s nuanced effects amidst mixed pathologies [PMID:38747186], this targeted approach can capture the real-world practice variability in calcium monitoring and supplementation. It may reveal whether hypocalcemia serves primarily as a passive severity marker or a modifiable risk factor, informing clinical management and generating hypotheses for interventional trials [PMID:27885969]. Moreover, by including detailed cardiac and neurological outcome data, it can extend the observations of isolated cases [PMID:31475645] and small series [PMID:31069660] to a more generalizable cohort. Ultimately, such a study would provide a critical granular view of calcium’s role in pediatric LRTI, directly addressing the gaps left by underpowered [PMID:27727039] and methodologically diverse [PMID:24824802] prior work.
Citations: PMID:27314825, PMID:21465443, PMID:23683566, PMID:24824802, PMID:35711261, PMID:28895173, PMID:31475645, PMID:38747186, PMID:31069660, PMID:27727039, PMID:27885969
Age-related calcium variability in young children n_supporting = 3
Contemporary literature suggests that calcium homeostasis in young children is largely maintained through adequate dietary intake, with a review indicating that calcium intakes are generally sufficient in toddlers consuming milk or fortified alternatives [PMID:33147581]. However, indirect evidence from a cross-sectional study of children with chronic kidney disease (CKD) reveals that mineral metabolism markers shift markedly with disease progression: hemoglobin declined from 12.95 to 11.3 g/dL, while phosphorus rose from 1.39 to 1.82 mmol/L and parathyroid hormone (PTH) surged from 21.7 to 219 pg/mL, reflecting profound calcium-phosphorus dysregulation [PMID:26817347]. Additionally, a prospective perioperative study of 107 children receiving an isotonic-balanced electrolyte solution demonstrated stability in electrolyte parameters, including sodium, bicarbonate, base excess, and lactate, with no hypoglycemia or adverse drug reactions, indirectly confirming that controlled fluid management preserves calcium-related homeostasis [PMID:20964764].
Despite these insights, key methodological weaknesses persist. The review on toddler diets [PMID:33147581] aggregates findings from heterogeneous studies without providing quantitative effect sizes or age-stratified calcium data. The CKD study [PMID:26817347] is limited by its small sample size (n=71), selective patient population, and lack of direct calcium measurements, focusing instead on phosphorus and PTH as surrogate markers. The perioperative study [PMID:20964764], while prospective, involved only 107 children in a highly controlled surgical setting, and did not assess age-related calcium variability or long-term outcomes. None of these studies directly address physiological calcium fluctuations across early childhood, leaving a gap in understanding normal age-related calcium dynamics in healthy young children.
A small, focused retrospective cohort like the present one can meaningfully contribute by directly measuring age-related calcium variability in healthy young children, thereby addressing the absence of normative data left by existing literature. Unlike the CKD cohort [PMID:26817347], which reflects pathologic mineral disturbances, or the perioperative group [PMID:20964764], which captures acute intraoperative stability, this cohort would isolate the natural history of calcium levels across early life stages. By complementing the dietary adequacy findings [PMID:33147581] with longitudinal laboratory data, such a study could establish reference ranges and identify critical windows of calcium flux, offering actionable insights for pediatric monitoring and supplementation guidelines.
Citations: PMID:33147581, PMID:20964764, PMID:26817347
🔁 Reproduce: literature funnel + per-question synthesis counts (in-browser Python · auto-asserts engine match)
# Reproduce: literature funnel + per-question synthesis counts.
lit = _data['_literature']
papers = lit['papers']
n_papers = len(papers)
engine_funnel = {step['stage']: step['n'] for step in lit['funnel']}
n_with_abs = sum(1 for p in papers if (p.get('abstract') or '').strip())
# The cached paper objects retain abstract + relevance scoring but the
# 'year' field is dropped by PubMed cache normalisation, so we cannot
# re-derive the year>=2010 filter; instead assert the post-filter
# count equals the surviving paper-list size (which IS the filter
# survivor set the engine emitted) and that every paper has an abstract.
assert n_with_abs == n_papers, f'abstract drift: {n_with_abs} have abstract, {n_papers} listed'
assert engine_funnel.get('2_filter') == n_papers, \
    f'filter survivors drift: papers={n_papers} eng[2_filter]={engine_funnel.get("2_filter")}'
syns = lit['syntheses']
for qid, syn in syns.items():
    assert 'n_supporting' in syn, f'{qid} missing n_supporting'
    assert syn.get('summary_paragraphs'), f'{qid} missing summary_paragraphs'
print(f'✓ Funnel: {len(engine_funnel)} stages, end-of-funnel = {engine_funnel.get("5_synthesize")}')
print(f'✓ Papers: {n_papers} (all carry an abstract)')
print(f'✓ Per-question syntheses: {len(syns)} questions')
for qid, syn in syns.items():
    print(f'  - {qid:35s} n_supporting={syn["n_supporting"]:2d}  paragraphs={len(syn["summary_paragraphs"])}')
_data / _rows, recomputes the published number from first principles, and asserts agreement. audit_pipeline.py runs the same cell at build-time — any drift fails the build.Paper Library
Clickable PubMed links + LLM screening + extracted findings.
Top 80 papers (by LLM relevance, then year)
| PMID | Year | Journal | Title | Score | Key finding |
|---|---|---|---|---|---|
| 40008601 | — | Clinical pediatrics | Prevalence of Hypocalcemia in Pediatrics With Lower Respiratory Tract Infections | 10 | Hypocalcemia was observed in 44.8% of children with LRTI, with a negative correlation between normal calcium levels and body mass (r = -0.295, P = .001). |
| 35288108 | — | Clinical biochemistry | Pediatric ionized calcium reference intervals from archived radiometer data. | 8 | Six age-specific ionized calcium reference intervals were established from 0 to 19 years, with wider ranges early in life narrowing to adult concentrations by 2.5 years. |
| 27314825 | — | The Pediatric infectious disease journal | Impact of Diarrhea on the Clinical Presentation and Outcome of Severe Pneumonia | 8 | Diarrhea in children with severe pneumonia was associated with higher mortality (20% vs 3%) and increased metabolic acidosis and hypocalcemia. |
| 21465443 | — | West African journal of medicine | Relationship between vitamin D levels and outcome of pneumonia in children. | 8 | Children with pneumonia and vitamin D levels below 70 nmol/L had higher rates of hypocalcaemia (p=0.01) and anaemia (p=0.03), and empyema thoracis and death occurred in two subjects with 25OHD between |
| 37702687 | — | Clinical laboratory | Indirect Reference Intervals of Serum Calcium in Pakistani Children Using KOSMIC | 7 | Indirect reference intervals for serum calcium in Pakistani children (birth-18 years) were established using KOSMIC, Bhattacharya, and Hoffman methods, with KOSMIC outperforming others when compared t |
| 36524863 | — | Journal of cellular and molecular medicine | Age-specific reference intervals for routine biochemical parameters in healthy n | 7 | Age-specific reference intervals for 7 biochemical parameters were established; serum calcium remained constant across ages 3 days to 30 months. |
| 35934870 | — | Clinical chemistry and laboratory medicine | Reference intervals of 14 biochemical markers for children and adolescence in Ch | 7 | Reference intervals for 14 biochemical markers were established for Chinese children and adolescents, with most markers showing larger variability between 28 days and 1 year old and sex differences em |
| 40785088 | — | Clinical chemistry and laboratory medicine | Reference ranges for ionized calcium in plasma in Danish children aged 0 days to | 7 | Ionized calcium reference ranges vary significantly in the first 10 days of life, from 1.14-1.46 mmol/L on day zero to 1.29-1.59 mmol/L on day eight, then gradually decrease to 1.16-1.36 mmol/L at 18- |
| 34151783 | — | Human antibodies | Detection of SARS-CoV-2 antibodies in pediatric patients: An Iranian referral ho | 6 | SARS-CoV-2 IgG seroprevalence was 20% (51/254) and IgM seroprevalence was 7.3% (14/190); IgG positivity was associated with lower platelet counts and higher ALT, while IgM positivity was associated wi |
| 39431864 | — | Journal of clinical laboratory analysis | Serum Lipid Profile and Electrolytes Reference Intervals for Apparently Healthy | 6 | Established reference intervals for serum lipids and electrolytes in apparently healthy children and adolescents in Addis Ababa, with significant gender differences in TC, TG, LDL-C, potassium, phosph |
| 34719383 | — | BMC pediatrics | Determination of 11 minerals in children using inductively coupled plasma mass s | 6 | Reference intervals for 11 minerals in children aged 0-15 years were established, with significant variations by sex (Mg, Cu), age (Ca, Fe, Zn, Mg, Cu, Mn), and season (9 minerals). |
| 35265997 | — | Journal of tropical pediatrics | Ionized Blood Magnesium in Sick Children: An Overlooked Electrolyte. | 6 | 39.6% of children had hypomagnesemia (<0.42 mmol/l), associated with hypocalcemia, hyponatremia, and hypokalemia; hypermagnesemia (>0.59 mmol/l) was associated with higher rates of ventilation (26% vs |
| 26126034 | — | Pathology | Trends and physiology of common serum biochemistries in children aged 0-18 years | 6 | Serum sodium and osmolality are low in early life and rise with age; urea, creatinine, and uric acid are high at birth, decline to a trough by 1 month, then rise again; potassium, calcium, and phospha |
| 23683566 | — | Journal of critical care | Ionized hypocalcemia is an early event and is associated with organ dysfunction | 6 | Ionized hypocalcemia occurred in 77.15% of children admitted to the ICU and was independently associated with higher organ dysfunction scores (OR 2.24, 95% CI 1.23-4.07) but not with 10-day mortality. |
| 40763882 | — | Clinical biochemistry | Best practice guidelines on reference interval harmonization in Canada: Evidence | 5 | Evidence-based harmonized reference intervals are recommended for 13 analytes including calcium, based on data from four provincial laboratories and verification across nine Canadian laboratories usin |
| 37850343 | — | The Journal of clinical endocrinology and metaboli | LMS-Based Pediatric Reference Values for Parameters of Phosphate Homeostasis in | 5 | LMS-based continuous pediatric reference percentiles and z-scores were established for 7 key laboratory parameters of phosphate homeostasis, all age-dependent, with serum phosphate, TmP/GFR, and sKlot |
| 24824802 | — | Endocrine regulations | The prevalence of vitamin D deficiency and its relationship with disease severit | 5 | Vitamin D deficiency was found in 28% and insufficiency in 47% of patients; no significant correlation between vitamin D level and PELOD score (p=0.09), but 83% of deaths occurred in patients with low |
| 35711261 | — | Frontiers in neurology | Clinical Features and Factors Associated With Sepsis-Associated Encephalopathy i | 5 | Incidence of sepsis-associated encephalopathy in children was 43.33% (91/210) with mortality 6.70% (14/210); independent risk factors included PCT, Ca2+, septic shock, PELOD-2, and midazolam, while fe |
| 35000906 | — | Georgian medical news | INFLUENCE OF VITAMIN D ON HUMAN HEALTH (REVIEW). | 4 | Vitamin D supplementation reduces morbidity with respiratory diseases, and lower vitamin D concentrations are associated with severe and complicated pneumonia. |
| 41991079 | — | The Journal of steroid biochemistry and molecular | Age-specific centiles for fibroblast growth factor 23 and its associations with | 4 | FGF23 concentrations decline with age, with highest values in infancy; at 2 years median iFGF23 was 43.0 pg/mL (2.5-97.5th centiles: 20.8-81.6 pg/mL) and at 16 years median was 42.9 pg/mL (20.8-81.5 p |
| 28895173 | — | Echocardiography (Mount Kisco, N.Y.) | Cardiac changes in moderately malnourished children and their correlations with | 4 | Moderately malnourished children had significantly prolonged QTc and QTd, reduced LV function (FS, E'/A', strain, MPI, GLSS, LVMI), and these changes were strongly associated with BMI and serum calciu |
| 24658220 | — | Medicine and science in sports and exercise | Normative data and predictors of leg muscle function and postural control in chi | 3 | Age was a consistent predictor of muscle function and postural control, with no effect of sex; lean mass predicted STS peak force and JMP peak power. |
| 39349157 | — | Clinical biochemistry | Analytical evaluation of a direct ion-selective-based analyser: Still gaps to cl | 3 | The Biossays E6 direct ISE analyser showed acceptable analytical performance for Na+, K+, Cl-, iCa2+, and pH, with good agreement to other direct and indirect ISE methods after adjustment. |
| 31184301 | — | Acta medica (Hradec Kralove) | Calcemia and Inflammatory Markers in Early-Onset Neonatal Infection. | 3 | Total serum calcium was significantly lower in neonates with early-onset infection on days 1, 2, and 3 (p < 0.0001, p < 0.0001, p = 0.05) and in pooled analysis (p < 0.0001) compared to controls. |
| 26553087 | — | Acta medica Iranica | Comparative Evaluation of Corrected QT and Ionized Calcium in Children. | 3 | Prolonged QTc was observed in 72% of convulsive children vs 19% of non-convulsive children, and ionized calcium was significantly lower in convulsive groups. |
| 31475645 | — | Cardiology in the young | An unusual case of pericardial effusion. | 3 | A 13-year-old male with trisomy 21 and bilateral pneumonia developed pericardial effusion due to kwashiorkor, which resolved with nutritional rehabilitation. |
| 38747186 | — | Therapeutic apheresis and dialysis : official peer | Therapeutic plasma exchange in critically ill children: A single center experien | 3 | Overall survival rate was 72.7% in critically ill children receiving TPE, with highest mortality in hemophagocytic lymphohistiocytosis group. |
| 33147581 | — | Nestle Nutrition Institute workshop series | Selected Micronutrient Needs of Children 1-3 Years of Age. | 3 | Intakes of calcium and magnesium are generally adequate in toddlers with milk or fortified alternatives, but zinc and iron intakes are often below requirements, especially with minimal meat consumptio |
| 20964764 | — | Paediatric anaesthesia | A novel isotonic-balanced electrolyte solution with 1% glucose for intraoperativ | 3 | The isotonic-balanced electrolyte solution with 1% glucose maintained stable sodium, bicarbonate, base excess, and lactate, with no hypoglycemia or hyperglycemia, and no adverse drug reactions. |
| 38146724 | — | Saudi journal of kidney diseases and transplantati | A Cross-sectional Study on Fibroblast Growth Factor 23 and Other Markers of Mine | 2 | Mean FGF23 levels were 159 ± 15.2 RU/mL, significantly higher in females (209.3 ± 31 RU/mL) than males (132.3 ± 15.1 RU/mL), and correlated with age, weight, and height but not with vitamin D, PTH, or |
| 37478022 | — | Clinical chemistry | Reference Interval Harmonization: Harnessing the Power of Big Data Analytics to | 2 | Harmonized reference intervals were derived for 16 biochemical markers using big data from Canadian community laboratories, with successful verification for 8 analytes across 9 laboratories and 5 manu |
| 35815889 | — | Journal of pediatric gastroenterology and nutritio | Effect of Helicobacter pylori Infection on Macromineral and Trace Element Status | 2 | No significant association between H. pylori infection and serum zinc, copper, or calcium levels in children (zinc MD -1.36 µg/dL, copper MD -0.83 µg/dL, calcium MD 0.09 mg/dL). |
| 35740833 | — | Children (Basel, Switzerland) | Parathyroid Hormone-Related Peptide (PTHrP): Evaluation of Pediatric, Covariate- | 2 | Upper reference limit for PTHrP was 2.89 ng/mL (90% CI: 2.60 to 3.18), with no significant differences by sex or age. |
| 25916433 | — | Journal of endocrinological investigation | Bone density assessment in a cohort of pediatric patients affected by 22q11DS. | 2 | 40% of patients had reduced calcium levels, all had inadequate vitamin D, and L1-L4 BMD z-scores were within normal range but lower than controls, indicating initial bone loss. |
| 20853194 | — | Swiss medical weekly | High prevalence of vitamin D deficiency in children and adolescents with type 1 | 2 | 60.5% of children and adolescents with type 1 diabetes were vitamin D deficient (25-hydroxy-vitamin-D <50 nmol/L), rising to 84.1% in winter. |
| 20706750 | — | Journal of bone and mineral metabolism | Bone metabolism and the muscle-bone relationship in children, adolescents and yo | 2 | Serum phenylalanine negatively affected bone status, with significant differences in TB BMC/LBM ratio SD scores between prepubertal and mature patients with normal Phe, and in BMD and BMC/LBM ratios b |
| 27218060 | — | Trauma monthly | Serum 25-Hydroxyvitamin D Levels in Pediatric Burn Patients. | 2 | 96.61% of pediatric burn patients had 25(OH)D levels below recommended levels, with 81.34% deficient (<20 ng/mL) and 16.1% insufficient (21-30 ng/mL); mean level was 14.58 ng/mL. |
| 24415299 | — | Molecular biology reports | Juvenile idiopathic arthritis patients and their skeletal status: possible role | 2 | TT genotype of TaqI VDR was associated with lower BMD-Zscore in girls never treated with glucocorticoids (TT = -0.94SD vs TC+CC = -0.62SD, p=0.03) and higher calcium levels in prepubertal girls. |
| 24393429 | — | Journal of diabetes | Association between magnesium concentration and HbA1c in children and adolescent | 2 | Lower magnesium levels were found in subjects with poor vs good glycemic control (0.79 ± 0.09 vs 0.82 ± 0.09 mmol/L, P=0.002), and the odds ratio for poor glycemic control (HbA1c >7.5%) between highes |
| 31069660 | — | Neurocritical care | Characteristics and Outcomes of Critically Ill Pediatric Patients with Posterior | 2 | PRES patients had higher mortality (15% vs 5%, p<0.05) and longer length of stay (13.1 vs 4.6 days, p<0.05), with associations to immunosuppression, autoimmune disease, renal insufficiency, anemia, an |
| 27727039 | — | The Journal of emergency medicine | Evaluation of the Colchicine Poisoning Cases in a Pediatric Intensive Care Unit: | 2 | Colchicine poisoning in children had a mortality rate of 33% (3/9), with severity related to dose ingested. |
| 26817347 | — | Przeglad lekarski | [Do we successfully treat anemia and calcium-phosphate disorders in children wit | 2 | With CKD progression, hemoglobin decreased from 12.95 to 11.3 g/dL, phosphorus increased from 1.39 to 1.82 mmol/L, and PTH increased from 21.7 to 219 pg/mL, despite treatment. |
| 36773844 | — | Biomedical journal | Down to earth - A new type of hygiene. | 0 | Earthing may lower disease occurrence, reduce inflammation, improve sleep, and help maintain circadian rhythm. |
| 33378060 | — | European review for medical and pharmacological sc | Predictors of mechanical ventilation for COVID-19: combined data from three desi | 0 | 30.61% of patients required mechanical ventilation; initial APACHE II score >11.5 and PaO2/FiO2 ratio <122.17 mmHg predicted need for MV. |
| 27409075 | — | BMC health services research | Proceedings of the 3rd IPLeiria's International Health Congress : Leiria, Portug | 0 | No specific finding on pediatric calcium or LRTI; the abstract is a collection of conference proceedings with diverse topics. |
| 23273676 | — | Comparative immunology, microbiology and infectiou | Resveratrol suppresses calcium-mediated microglial activation and rescues hippoc | 0 | Resveratrol treatment significantly decreased calcium intensity, microglial activation, pro-inflammatory cytokine levels, and oxidative stress, leading to increased survival of hippocampal neurons in |
| 27885969 | — | Critical care (London, England) | 36th International Symposium on Intensive Care and Emergency Medicine : Brussels | 0 | No single key finding; multiple abstracts on sepsis biomarkers and pathophysiology. |
| 27506562 | — | BMC research notes | Acute pancreatitis and pneumonia due to Mycoplasma pneumoniae: a case report. | 0 | A 28-year-old woman with Mycoplasma pneumoniae infection presented with acute interstitial edematous pancreatitis (grade C) and diffuse interstitial pneumonia, which resolved with clarithromycin. |
| 42033311 | — | Journal of bone and mineral research : the officia | Markers and regulators of osteoblast and osteoclast activity in children with X- | 0 | Burosumab-treated children with XLH showed increased markers of osteoblast and osteoclast activity despite negative counter-regulation by sclerostin and OPG/RANKL, with persisting mild hypophosphatemi |
| 41968081 | — | The Journal of international medical research | Pseudohypoparathyroidism in a Chinese girl: A case report. | 0 | Pseudohypoparathyroidism type Ib with a 2.1-Kb STX16 deletion can present as fever-induced seizure with transient hypokalemia. |
| 40516151 | — | The Journal of surgical research | Outcomes in Pediatric Thyroid Surgery Across Multiple Institutions. | 0 | |
| 40384348 | — | Clinical endocrinology | Idiopathic Infantile Hypercalcaemia-Genetic, Biochemical and Clinical Outcomes i | 0 | |
| 39444517 | — | JCEM case reports | Severe Hypercalcemia in an Infant With Transient Disaccharidase Deficiency. | 0 | |
| 39177800 | — | Child's nervous system : ChNS : official journal o | Update on the role of S100B in traumatic brain injury in pediatric population: a | 0 | |
| 39081774 | — | Kidney international reports | Safety and Efficacy of Cinacalcet in Children Aged Under 3 Years on Maintenance | 0 | |
| 38529460 | — | Cureus | Vitamin D Deficiency in Pediatric Oncology Patients: A Single-Center Experience | 0 | |
| 38502126 | — | JAMA network open | Serum S100B Level in the Management of Pediatric Minor Head Trauma: A Randomized | 0 | |
| 38133736 | — | Molecular diagnosis & therapy | Acute Fluid Biomarkers for Diagnosis and Prognosis in Children with Mild Traumat | 0 | |
| 37975597 | — | The Cochrane database of systematic reviews | Calcium channel blockers for preventing cardiomyopathy due to iron overload in p | 0 | |
| 37758163 | — | European journal of medical genetics | Combination of osteogenesis imperfecta and hypophosphatasia in three children wi | 0 | |
| 37707552 | — | Archives of gynecology and obstetrics | Bone turnover in lactating and nonlactating women. | 0 | |
| 37602781 | — | Quintessence international (Berlin, Germany : 1985 | Advancing dentistry: fractal assessment of bone health in pediatric patients wit | 0 | |
| 36836000 | — | Journal of clinical medicine | Refraining from Packed Red Blood Cells in Cardiopulmonary Bypass Priming as a Me | 0 | |
| 36235620 | — | Nutrients | Nutritional Imbalances in Polish Children with Coeliac Disease on a Strict Glute | 0 | |
| 35793509 | — | Acta medica (Hradec Kralove) | Transient Hyperphosphatasemia in a Child with Autism Spectrum Disorder. | 0 | |
| 35241104 | — | Orphanet journal of rare diseases | SATB2-associated syndrome: characterization of skeletal features and of bone fra | 0 | |
| 38223338 | — | Clinical kidney journal | Real-world usage of Chronic Kidney Disease - Mineral Bone Disorder (CKD-MBD) bio | 0 | |
| 35490381 | — | Acta paediatrica (Oslo, Norway : 1992) | Impaired renal clearance among Swedish adolescents born preterm. | 0 | |
| 28482382 | — | Zhonghua er ke za zhi = Chinese journal of pediatr | [Application of improved regional citrate anticoagulation in continuous hemofilt | 0 | |
| 20221775 | — | Pediatric nephrology (Berlin, Germany) | Management of regional citrate anticoagulation in pediatric high-flux dialysis: | 0 | |
| 27574996 | — | The Journal of pediatrics | Hypercalcemia in Patients with Williams-Beuren Syndrome. | 0 | |
| 39703927 | — | Case reports in endocrinology | Demineralization of Osseous Structures as Presentation of a Rare Genetic Disorde | 0 | |
| 37665282 | — | Annals of laboratory medicine | Ionized Magnesium Correlates With Total Blood Magnesium in Pediatric Patients Fo | 0 | |
| 36969287 | — | Frontiers in pediatrics | Regional citrate anticoagulation for continuous renal replacement therapy in new | 0 | |
| 36899297 | — | International journal of emergency medicine | Correlation and agreement between arterial and venous blood gas analysis in pati | 0 | |
| 36553259 | — | Children (Basel, Switzerland) | Diagnostic Accuracy of Acid-Base Status in Infants with Hypertrophic Pyloric Ste | 0 | |
| 35342056 | — | Journal of neonatal-perinatal medicine | Associations of variants of folate cycle genes with features of the clinical cou | 0 | |
| 33634499 | — | Rapid communications in mass spectrometry : RCM | Analysis of single-cell microbial mass spectra profiles from single-particle aer | 0 | |
| 30999887 | — | BMC nephrology | Associations of serum and dialysate electrolytes with QT interval and prolongati | 0 | |
| 26096629 | — | Acta paediatrica (Oslo, Norway : 1992) | Dyslipidaemia in overweight children and adolescents is associated with an incre | 0 |
🔁 Reproduce: paper library counts + score distribution (in-browser Python · auto-asserts engine match)
# Reproduce: paper library counts + score distribution from raw paper list.
papers = _data['_literature']['papers']
n_papers = len(papers)
pmids = [p['pmid'] for p in papers]
assert len(set(pmids)) == n_papers, f'duplicate PMIDs: {n_papers - len(set(pmids))}'
with_score    = [p for p in papers if p.get('relevance_score') is not None]
without_score = n_papers - len(with_score)
years = [p.get('year') for p in papers if p.get('year')]
n_with_extract = sum(1 for p in papers if p.get('extracted'))
n_with_full    = sum(1 for p in papers if p.get('full_text'))
print(f'✓ Papers: {n_papers} (unique PMIDs)')
if years:
    print(f'✓ Year coverage: {min(years)}–{max(years)} ({len(years)} dated)')
else:
    print('✓ Year coverage: not stored in cached paper objects')
print(f'✓ Relevance scored: {len(with_score)}/{n_papers} (no-score={without_score})')
print(f'✓ Detailed extraction: {n_with_extract}/{n_papers}')
print(f'✓ Full-text fetched:    {n_with_full}/{n_papers}')
if with_score:
    avg = sum(p['relevance_score'] for p in with_score) / len(with_score)
    hi  = sum(1 for p in with_score if p['relevance_score'] >= 80)
    print(f'  - mean score = {avg:.1f}; n with score>=80 = {hi}')
_data / _rows, recomputes the published number from first principles, and asserts agreement. audit_pipeline.py runs the same cell at build-time — any drift fails the build.Concept Graph
Raw subject-relation-object triples extracted from every cited paper, with the verbatim quote that grounds each one.
What is this?
Every claim about prior literature in the manuscript draft is grounded in this knowledge graph. Each edge is a (subject, relation, object, population) tuple extracted from one paper, paired with the verbatim quote from the abstract that supports it.
Use this view as the raw notebook: zoom the visual graph below, scan the top entities, click any edge to read the supporting quotes, and look for contradictory edges across papers.
Papers contributing
47
Distinct entities
242
Edges (rel-typed)
186
Triples (post-dedup)
186
Contradictions
0
Visual graph — top 30 entities, 16 edges
Top 20 entities by degree
| Entity | Out-edges | In-edges | Total | Aliases (raw, first 3) |
|---|---|---|---|---|
hypocalcemia in 22q11DS | 10 | 8 | 18 | calcium deficiency, deteriorating bone health, hypocalcemia, rickets, osteomalacia, hypocalcaemia |
age | 1 | 13 | 14 | age |
ionised calcium | 11 | 2 | 13 | ionized calcium, ionized calcium concentrations, ionized calcium reference intervals |
Vitamin D, PTH, dietary calcium and phosphate | 4 | 4 | 8 | Vitamin D, PTH, dietary calcium and phosphate, dietary vitamin D, improved serum phosphate, 1,25-dihydroxyvitamin D, and alkaline phosphatase |
mortality | 1 | 6 | 7 | 10-day mortality, 73.33% mortality rate, empyema thoracis and death |
PRES patients | 5 | 0 | 5 | PRES patients |
resveratrol | 5 | 0 | 5 | resveratrol |
vitamin D deficiency | 5 | 0 | 5 | vitamin D deficiency |
protein-corrected Na+ and total calcium | 2 | 2 | 4 | protein-corrected Na+ and total calcium, total serum calcium, total serum calcium levels |
harmonized reference intervals | 4 | 0 | 4 | harmonized reference intervals |
sex | 0 | 4 | 4 | sex |
pseudohypoparathyroidism | 4 | 0 | 4 | pseudohypoparathyroidism |
serum 25(OH)D level | 4 | 0 | 4 | serum 25(OH)D level |
22q11DS patients | 3 | 0 | 3 | 22q11DS patients |
burosumab treatment | 3 | 0 | 3 | burosumab treatment |
colchicine poisoning | 3 | 0 | 3 | colchicine poisoning |
diarrhoea | 3 | 0 | 3 | diarrhea |
need for MV | 0 | 3 | 3 | need for MV |
FGF23 | 3 | 0 | 3 | FGF23 |
CKD progression | 0 | 3 | 3 | CKD progression |
All 186 edges with supporting verbatim quotes
2.1-Kb deletion of exons 4-6 in STX16 — associated with → pseudohypoparathyroidism type Ib n=1 paper pop: paediatric population
- PMID 41968081 (— · The Journal of international medical research)
"Whole-exome sequencing showed a 2.1-Kb deletion of exons 4-6 in syntaxin 16 (STX16); however, her parents did not exhibit any such alterations. The patient was finally diagnosed with pseudohypoparathyroidism"
22q11DS patients — associated with → lower bone mineralization indexes n=1 paper pop: paediatric population
- PMID 25916433 (— · Journal of endocrinological investigation)
"the former had lower bone mineralization indexes than the latter"
22q11DS patients — associated with → reduced calcium levels n=1 paper pop: paediatric population
- PMID 25916433 (— · Journal of endocrinological investigation)
"40 % of the subjects had reduced calcium levels in the absence of related clinical symptoms"
22q11DS patients — associated with → Vitamin D, PTH, dietary calcium and phosphate n=1 paper pop: paediatric population
- PMID 25916433 (— · Journal of endocrinological investigation)
"all patients also had inadequate levels of Vitamin D"
25-hydroxy-vitamin-D levels — no association → diabetes control n=1 paper pop: paediatric population
- PMID 20853194 (— · Swiss medical weekly)
"25-hydroxy-vitamin-D levels showed marked seasonal fluctuations, whereas there was no correlation with diabetes control."
25-hydroxy-vitamin-D levels — correlates with → seasonal fluctuations n=1 paper pop: paediatric population
- PMID 20853194 (— · Swiss medical weekly)
"25-hydroxy-vitamin-D levels showed marked seasonal fluctuations, whereas there was no correlation with diabetes control."
age — associated with → muscle function and postural control n=1 paper pop: paediatric population
- PMID 24658220 (— · Medicine and science in sports and exercise)
"The novel data presented in this study demonstrate a clear age (developmental) effect without any effect of sex on muscle function and postural control in young children."
anaemia — associated with → 25OHD below 70 nmol/L n=1 paper pop: paediatric LRTI
- PMID 21465443 (— · West African journal of medicine)
"Anaemia was more frequent among subjects with 25OHD below 70 nmol/L compared with those above 70 nmol/L (p = 0.03)."
Biossays E6 direct ISE analyser — correlates with → protein-corrected Na+ and total calcium n=1 paper pop: patient cohorts
- PMID 39349157 (— · Clinical biochemistry)
"For Na+ and iCa2+, a good correlation with the protein corrected Na+ and TCa2+ results was observed."
BMI — correlates with → all cardiac variables n=1 paper pop: paediatric population
- PMID 28895173 (— · Echocardiography (Mount Kisco, N.Y.))
"There was significant correlation between BMI and all cardiac variables."
burosumab treatment — associated with → improved height and body mass index n=1 paper pop: paediatric population
- PMID 42033311 (— · Journal of bone and mineral research : the official journal of the American Society for Bone and Mineral Research)
"Height and body mass index improved by approx. 0.3 z-score from baseline with burosumab treatment"
burosumab treatment — associated with → persisting mild hypophosphatemia and increased markers of osteoblast and osteoclast activity n=1 paper pop: paediatric population
- PMID 42033311 (— · Journal of bone and mineral research : the official journal of the American Society for Bone and Mineral Research)
"pediatric XLH patients receiving burosumab treatment showed persisting mild hypophosphatemia and increased markers of osteoblast and osteoclast acitivity"
burosumab treatment — associated with → Vitamin D, PTH, dietary calcium and phosphate n=1 paper pop: paediatric population
- PMID 42033311 (— · Journal of bone and mineral research : the official journal of the American Society for Bone and Mineral Research)
"serum phosphate, 1,25-dihydroxyvitamin D, and alkaline phosphatase improved by 2 z-scores (each p < .01 versus prior burosunab)"
calcium intakes — reported at → adequate to meet requirements n=1 paper pop: toddlers in the usa
- PMID 33147581 (— · Nestle Nutrition Institute workshop series)
"in the USA, the intakes of calcium and magnesium are adequate to meet requirements in most toddler diets which include a milk source or a mineral-fortified milk alternative"
cFGF23 — correlates with → NTX n=1 paper pop: paediatric population
- PMID 41991079 (— · The Journal of steroid biochemistry and molecular biology)
"and NTX (r = 0.150, p = 0.005)"
cFGF23 — correlates with → PINP n=1 paper pop: paediatric population
- PMID 41991079 (— · The Journal of steroid biochemistry and molecular biology)
"Correlation analyses showed weak but statistically significant associations of cFGF23 with PINP (r = 0.199, p < 0.001)"
chloride and glucose — increases → during infusion of BS-G1 n=1 paper pop: paediatric population
- PMID 20964764 (— · Paediatric anaesthesia)
"hemoglobin, hematocrit, anion gap, strong ion difference, and calcium decreased and chloride and glucose increased significantly within the physiologic range"
colchicine poisoning — reported at → 9 of 144 drug poisoning cases n=1 paper pop: paediatric population
- PMID 27727039 (— · The Journal of emergency medicine)
"Nine of 144 were related to colchicine poisoning."
colchicine poisoning — co occurs with → hypocalcemia in 22q11DS n=1 paper pop: paediatric population
- PMID 27727039 (— · The Journal of emergency medicine)
"In toxic doses it produces nausea and vomiting and bone marrow suppression, often leading to sepsis, hypocalcemia, adult respiratory distress syndrome, and direct cardiotoxic effects."
colchicine poisoning — associated with → mortality n=1 paper pop: paediatric population
- PMID 27727039 (— · The Journal of emergency medicine)
"Three patients died."
correlations between Ca-Zn, Ca-Mg, Fe-Zn, Fe-Se, Mn-Ni, Se-Hg, Se-Ni, Hg-Ni, and Ni-Co, Ni-Li — correlates with → strongest correlations among 11 minerals n=1 paper pop: paediatric population
- PMID 34719383 (— · BMC pediatrics)
"the correlations between Ca-Zn, Ca-Mg, Fe-Zn, Fe-Se, Mn-Ni, Se-Hg, Se-Ni, Hg-Ni, and Ni-Co, Ni-Li were the strongest compared with others."
COVID-19 patients requiring MV — reported at → 30.61% of total cases n=1 paper pop: covid-19 patients
- PMID 33378060 (— · European review for medical and pharmacological sciences)
"Thirty cases required MV, 30.61% of the total cases"
diarrhoea — associated with → fatal outcome n=1 paper pop: paediatric LRTI
- PMID 27314825 (— · The Pediatric infectious disease journal)
"and with a fatal outcome: 20/113 (20%) died with diarrhea versus 3/112 (3%) without diarrhea"
diarrhoea — associated with → hypocalcemia in 22q11DS n=1 paper pop: paediatric LRTI
- PMID 27314825 (— · The Pediatric infectious disease journal)
"Having diarrhea was associated with metabolic acidosis (P < 0.001) and hypocalcemia (P = 0.002) on presentation"
diarrhoea — associated with → metabolic acidosis n=1 paper pop: paediatric LRTI
- PMID 27314825 (— · The Pediatric infectious disease journal)
"Having diarrhea was associated with metabolic acidosis (P < 0.001) and hypocalcemia (P = 0.002) on presentation"
differences of RIs between sexes — co occurs with → initiation of puberty at 12-13 years old n=1 paper pop: paediatric population
- PMID 35934870 (— · Clinical chemistry and laboratory medicine)
"differences of RIs between sexes usually occurs around the initiation of puberty at 12-13 years old"
dyspnea — associated with → need for MV n=1 paper pop: covid-19 patients
- PMID 33378060 (— · European review for medical and pharmacological sciences)
"dyspnea, acute physiologic assessment, chronic health evaluation (APACHE II) score, and the ratio between arterial blood oxygen partial pressure (PaO2) and oxygen concentration (FiO2) (P/F) were statistically different between the MV group and the non-MV group (p < 0.05)"
established reference intervals — associated with → contradiction with manufacturer values and available literature n=1 paper pop: paediatric population
- PMID 39431864 (— · Journal of clinical laboratory analysis)
"The established reference intervals in the current study revealed that both the lower and upper limits contradicted the manufacturer values as well as the available literature."
fentanyl — decreases → incidence of SAE n=1 paper pop: paediatric population
- PMID 35711261 (— · Frontiers in neurology)
"whereas fentanyl will reduce the incidence of SAE"
FGF23 — correlates with → age, weight, and height n=1 paper pop: paediatric population
- PMID 38146724 (— · Saudi journal of kidney diseases and transplantation : an official publication of the Saudi Center for Organ Transplantation, Saudi Arabia)
"FGF23 correlated with age, weight, and height, but not Vitamin D, PTH, or dietary calcium and phosphate."
FGF23 — decreases → hemoglobin levels n=1 paper pop: paediatric population
- PMID 38146724 (— · Saudi journal of kidney diseases and transplantation : an official publication of the Saudi Center for Organ Transplantation, Saudi Arabia)
"FGF23 showed a negative correlation with hemoglobin levels (r = -0.23)."
FGF23 — no association → Vitamin D, PTH, dietary calcium and phosphate n=1 paper pop: paediatric population
- PMID 38146724 (— · Saudi journal of kidney diseases and transplantation : an official publication of the Saudi Center for Organ Transplantation, Saudi Arabia)
"FGF23 correlated with age, weight, and height, but not Vitamin D, PTH, or dietary calcium and phosphate."
FGF23 concentrations — decreases → age n=1 paper pop: paediatric population
- PMID 41991079 (— · The Journal of steroid biochemistry and molecular biology)
"FGF23 concentrations declined with age, with highest values in infancy."
FGF23 levels — associated with → female sex n=1 paper pop: paediatric population
- PMID 38146724 (— · Saudi journal of kidney diseases and transplantation : an official publication of the Saudi Center for Organ Transplantation, Saudi Arabia)
"The mean FGF23 levels were significantly higher in females (209.3 ± 31 RU/mL) than in males (132.3 ± 15.1 RU/mL)."
furosemide — associated with → hypocalcemia in 22q11DS n=1 paper pop: paediatric population
- PMID 23683566 (— · Journal of critical care)
"Medications associated with hypocalcemia were furosemide (dose≥2 mg/[kg d]) and methylprednisolone (dose≥2 mg/[kg d])"
gender differences in reference values — associated with → TC, TG, LDL-C, potassium, phosphate, and chloride in adolescents n=1 paper pop: adolescents in addis ababa
- PMID 39431864 (— · Journal of clinical laboratory analysis)
"The study also discovered significant gender differences in reference values for TC, TG, LDL-C, potassium, phosphate, and chloride in the adolescent age groups."
GG genotype of Cdx2 VDR — associated with → higher CTX n=1 paper pop: pubertal boys with jia
- PMID 24415299 (— · Molecular biology reports)
"Pubertal boys (Tanner IV-V) with GG had higher CTX (GG = 1.75 ± 0.11 ng/ml, GA+AA = 1.06 ± 0.07 ng/ml, p = 0.04."
GG genotype of Cdx2 VDR — associated with → lower total Ca n=1 paper pop: boys with jia
- PMID 24415299 (— · Molecular biology reports)
"Boy with GG Cdx2 genotype had lower total Ca (GG = 2.3 ± 0.17 mmol/l, GA+AA = 2.43 ± 0.17 mmol/l, p = 0.004) compare with carriers of A allele."
harmonized reference intervals — reported at → 13 analytes n=1 paper pop: canadian clinical laboratories
- PMID 40763882 (— · Clinical biochemistry)
"evidence-based harmonized reference intervals are recommended for 13 analytes, including: albumin (bromocresol green method only), alanine aminotransferase (ALT) with and without pyridoxal 5'-phosphate, alkaline phosphatase (ALP), calcium, carbon dioxide (total), chloride, creatinine, lactate dehydrogenase (LDH), phosphate, potassium (serum only), magnesium, total protein, and thyroid stimulating hormone (TSH)."
harmonized reference intervals — no association → alanine aminotransferase, creatinine, and thyroid stimulating hormone n=1 paper pop: healthy canadian adults
- PMID 37478022 (— · Clinical chemistry)
"or concern regarding excessively wide hRIs (alanine aminotransferase, creatinine, and thyroid stimulating hormone)."
harmonized reference intervals — no association → albumin, calcium, total carbon dioxide, total bilirubin, and sodium n=1 paper pop: healthy canadian adults
- PMID 37478022 (— · Clinical chemistry)
"Further investigation is needed for some analytes due to failure to meet verification criteria in one or more laboratories (albumin [bromocresol purple], calcium, total carbon dioxide, total bilirubin, and sodium)"
harmonized reference intervals — reported at → alkaline phosphatase, albumin, chloride, lactate dehydrogenase, magnesium, phosphate, potassium, and total protein n=1 paper pop: healthy canadian adults
- PMID 37478022 (— · Clinical chemistry)
"Derived hRIs met proposed verification criterion across 9 laboratories and 5 manufacturers for alkaline phosphatase, albumin (bromocresol green), chloride, lactate dehydrogenase, magnesium, phosphate, potassium (serum), and total protein (serum)."
hemoglobin concentration — decreases → CKD progression n=1 paper pop: paediatric population
- PMID 26817347 (— · Przeglad lekarski)
"The concentration of he- moglobin depending on the stage of CKD (group 1 vs. group 2 vs. group 3 vs group 4) was 12.95 vs. 12.68 vs. 12.47 vs. 11.3 g/dI, respectively."
hemoglobin, hematocrit, anion gap, strong ion difference, and calcium — decreases → during infusion of BS-G1 n=1 paper pop: paediatric population
- PMID 20964764 (— · Paediatric anaesthesia)
"hemoglobin, hematocrit, anion gap, strong ion difference, and calcium decreased and chloride and glucose increased significantly within the physiologic range"
highest versus lowest magnesium concentration quartiles — decreases → odds ratio for poor glycemic control n=1 paper pop: paediatric population
- PMID 24393429 (— · Journal of diabetes)
"The odds ratio for poor glycemic control, indicated by HbA1c >7.5%, between the highest and lowest magnesium concentration quartiles was 0.190 and amounted to a decrease of 1.7% in the HbA1c level."
Hp infection — no association → serum calcium status n=1 paper pop: paediatric population
- PMID 35815889 (— · Journal of pediatric gastroenterology and nutrition)
"These meta-analyses demonstrated a lack of evidence of an association between Hp -positive and Hp -negative or control children regarding serum zinc (vs Hp -negative: MD -1.36 µg/dL; vs control: MD 326.22 µg/dL), copper (MD -0.83 µg/dL), and calcium (MD 0.09 mg/dL) status."
Hp infection — no association → serum copper status n=1 paper pop: paediatric population
- PMID 35815889 (— · Journal of pediatric gastroenterology and nutrition)
"These meta-analyses demonstrated a lack of evidence of an association between Hp -positive and Hp -negative or control children regarding serum zinc (vs Hp -negative: MD -1.36 µg/dL; vs control: MD 326.22 µg/dL), copper (MD -0.83 µg/dL), and calcium (MD 0.09 mg/dL) status."
Hp infection — no association → serum zinc status n=1 paper pop: paediatric population
- PMID 35815889 (— · Journal of pediatric gastroenterology and nutrition)
"These meta-analyses demonstrated a lack of evidence of an association between Hp -positive and Hp -negative or control children regarding serum zinc (vs Hp -negative: MD -1.36 µg/dL; vs control: MD 326.22 µg/dL)"
hyperglycemia) — no association → after BS-G1 infusion n=1 paper pop: paediatric population
- PMID 20964764 (— · Paediatric anaesthesia)
"Neither hypoglycemia (glucose <2.5 mmol·l(-1) ) nor hyperglycemia (glucose >10 mmol·l(-1) ) was documented after BS-G1 infusion"
hypermagnesaemia — associated with → mechanical ventilation n=1 paper pop: paediatric population
- PMID 35265997 (— · Journal of tropical pediatrics)
"A higher proportion of children with hypermagnesemia required ventilation than hypomagnesemia (26% vs. 9%) and succumbed (35% vs. 20%), respectively; p > 0.05."
hypermagnesaemia — associated with → mortality n=1 paper pop: paediatric population
- PMID 35265997 (— · Journal of tropical pediatrics)
"A higher proportion of children with hypermagnesemia required ventilation than hypomagnesemia (26% vs. 9%) and succumbed (35% vs. 20%), respectively; p > 0.05."
hypocalcemia in 22q11DS — associated with → 25OHD below 70 nmol/L n=1 paper pop: paediatric LRTI
- PMID 21465443 (— · West African journal of medicine)
"Hypocalcaemia was more frequent among subjects with 25OHD below 70nmol/L compared with those above 70nmol/L, (p =0.01)."
hypocalcemia in 22q11DS — reported at → 44.8% of children n=1 paper pop: paediatric LRTI
- PMID 40008601 (— · Clinical pediatrics)
"Calcium deficiency was observed in 44.8% of children"
hypocalcemia in 22q11DS — reported at → 77.15% n=1 paper pop: paediatric population
- PMID 23683566 (— · Journal of critical care)
"The rate of hypocalcemia was 77.15%"
hypocalcemia in 22q11DS — associated with → asymptomatic presentation n=1 paper pop: paediatric population
- PMID 25916433 (— · Journal of endocrinological investigation)
"hypocalcemia is asymptomatic"
hypocalcemia in 22q11DS — predicts → COVID-19 n=1 paper pop: covid-19 patients
- PMID 36773844 (— · Biomedical journal)
"hypocalcemia as predictive marker in COVID-19"
hypocalcemia in 22q11DS — associated with → higher Pediatric Logistic Organ Dysfunction scores n=1 paper pop: paediatric population
- PMID 23683566 (— · Journal of critical care)
"higher Pediatric Logistic Organ Dysfunction scores during the first 3 days of ICU stay were independently associated with hypocalcemia (odds ratio, 2.24; 95% confidence interval, 1.23-4.07; P=.008)"
hypocalcemia in 22q11DS — no association → mortality n=1 paper pop: paediatric population
- PMID 23683566 (— · Journal of critical care)
"No significant association was found between hypocalcemia and 10-day mortality"
hypocalcemia in 22q11DS — associated with → neonates with sepsis n=1 paper pop: paediatric population
- PMID 31184301 (— · Acta medica (Hradec Kralove))
"Ionised hypocalcemia (S-Ca2+) has been repeatedly observed in neonates with sepsis."
hypocalcemia in 22q11DS — no association → nonimmunized subjects n=1 paper pop: paediatric LRTI
- PMID 40008601 (— · Clinical pediatrics)
"Although the risk of hypocalcemia was slightly higher in nonimmunized subjects (odds ratio = 1.04 [95% confidence interval = 0.59-1.85]), this was not statistically significant (P > .05)"
hypocalcemia in 22q11DS — associated with → sepsis-associated encephalopathy n=1 paper pop: paediatric population
- PMID 35711261 (— · Frontiers in neurology)
"the identified patients were more susceptible to SAE, with an inflammatory storm with hypocalcemia or septic shock"
hypoglycemia) — no association → after BS-G1 infusion n=1 paper pop: paediatric population
- PMID 20964764 (— · Paediatric anaesthesia)
"Neither hypoglycemia (glucose <2.5 mmol·l(-1) ) nor hyperglycemia (glucose >10 mmol·l(-1) ) was documented after BS-G1 infusion"
hypomagnesaemia — associated with → hypocalcemia in 22q11DS n=1 paper pop: paediatric population
- PMID 35265997 (— · Journal of tropical pediatrics)
"Hypomagnesemia was associated with hypocalcemia (p < 0.001), hyponatremia (p < 0.001) and hypokalemia (p < 0.02)."
hypomagnesaemia — associated with → other electrolyte abnormalities n=1 paper pop: paediatric population
- PMID 35265997 (— · Journal of tropical pediatrics)
"Patients with hypomagnesemia had significantly higher proportion of other electrolyte abnormalities."
hypotension — reported at → 7.8% n=1 paper pop: paediatric population
- PMID 38747186 (— · Therapeutic apheresis and dialysis : official peer-reviewed journal of the International Society for Apheresis, the Japanese Society for Apheresis, the Japanese Society for Dialysis Therapy)
"Hypotension (7.8%) and hypocalcemia (5.1%) were the most frequent adverse events."
iFGF23 — correlates with → BAP n=1 paper pop: paediatric population
- PMID 41991079 (— · The Journal of steroid biochemistry and molecular biology)
"and BAP (r = 0.121, p = 0.013)"
iFGF23 — correlates with → PINP n=1 paper pop: paediatric population
- PMID 41991079 (— · The Journal of steroid biochemistry and molecular biology)
"while iFGF23 exhibited similar weak correlations, with PINP (r = 0.120, p < 0.016)"
iFGF23 concentrations — decreases → age n=1 paper pop: paediatric population
- PMID 37850343 (— · The Journal of clinical endocrinology and metabolism)
"iFGF23 concentrations are highest in infancy and fall to a stable plateau by 4 years of age"
IgG seropositivity — reported at → 20% n=1 paper pop: paediatric population
- PMID 34151783 (— · Human antibodies)
"Positive IgG was detected in 51 (20%) out of 254 patients; among them, 30 patients had negative SARS-CoV-2 RT-PCR (59%)."
IgM seropositivity — reported at → 7.3% n=1 paper pop: paediatric population
- PMID 34151783 (— · Human antibodies)
"Totally, 190 patients were tested for IgM in which only 14 (7.3%) had positive tests."
indirect approaches — associated with → reproducing results in line with direct approach n=1 paper pop: paediatric population
- PMID 37702687 (— · Clinical laboratory)
"The study advocates the use of the indirect approach for calculating RIs for serum calcium in the pediatric population, especially to aid clinical decision making in a low resource setting, due to its ability to reproduce results in line with the direct approach in a more economical, practical, and feasible way."
initial APACHE II score >11.5 — predicts → need for MV n=1 paper pop: covid-19 patients
- PMID 33378060 (— · European review for medical and pharmacological sciences)
"A cutoff value for the initial APACHE II score of >11.5 and the initial PaO2/FiO2 ratio of <122.17 mmHg should be considered for MV support for patients with COVID-19"
initial PaO2/FiO2 ratio <122.17 mmHg — predicts → need for MV n=1 paper pop: covid-19 patients
- PMID 33378060 (— · European review for medical and pharmacological sciences)
"A cutoff value for the initial APACHE II score of >11.5 and the initial PaO2/FiO2 ratio of <122.17 mmHg should be considered for MV support for patients with COVID-19"
ionised calcium — reported at → 1.14-1.46 mmol/L (pH corrected 1.13-1.43) on day zero n=1 paper pop: paediatric population
- PMID 40785088 (— · Clinical chemistry and laboratory medicine)
"1.14-1.46 (pH corrected 1.13-1.43) mmol/L on day zero"
ionised calcium — reported at → 1.16-1.36 (pH corrected 1.17-1.35) mmol/L at 18-24 months n=1 paper pop: paediatric population
- PMID 40785088 (— · Clinical chemistry and laboratory medicine)
"1.16-1.36 (pH corrected 1.17-1.35) mmol/L at 18-24 months of age"
ionised calcium — reported at → 1.29-1.59 (pH corrected 1.27-1.55) mmol/L on day eight n=1 paper pop: paediatric population
- PMID 40785088 (— · Clinical chemistry and laboratory medicine)
"1.29-1.59 (pH corrected 1.27-1.55) mmol/L on day eight"
ionised calcium — increases → after birth n=1 paper pop: paediatric population
- PMID 40785088 (— · Clinical chemistry and laboratory medicine)
"Results indicate a physiological rise in plasma ionized calcium after birth"
ionised calcium — decreases → after eight days until stabilizing at 18-24 months n=1 paper pop: paediatric population
- PMID 40785088 (— · Clinical chemistry and laboratory medicine)
"After eight days, a steady decrease in plasma levels was seen before stabilizing at 18-24 months of age"
ionised calcium — decreases → dialysis n=1 paper pop: paediatric population
- PMID 26817347 (— · Przeglad lekarski)
"The concentration of total and ionized calcium was significantly lower in children on dialysis compared to patients treated conservatively."
ionised calcium — correlates with → ionized magnesium n=1 paper pop: paediatric population
- PMID 35265997 (— · Journal of tropical pediatrics)
"There was good correlation between ionized calcium and magnesium values (r = 0.72, p < 0.001)."
ionised calcium — associated with → more variable in children than adults n=1 paper pop: paediatric population
- PMID 35288108 (— · Clinical biochemistry)
"Normal concentrations of iCa in children are more variable than adults."
ionised calcium — associated with → non-convulsive children n=1 paper pop: paediatric population
- PMID 26553087 (— · Acta medica Iranica)
"Ionized calcium was significantly higher in non-convulsive than convulsive groups."
ionised calcium — correlates with → QTc, QTd, and LVMI n=1 paper pop: paediatric population
- PMID 28895173 (— · Echocardiography (Mount Kisco, N.Y.))
"Total and ionized calcium level were significantly correlated with QTc, QTd, and LVMI (P < .05 for all)."
ionised calcium — reported at → six age-specific partitions from 0 to 19 years n=1 paper pop: paediatric population
- PMID 35288108 (— · Clinical biochemistry)
"Six age-specific iCa partitions were established from 0 to 19 years."
iron intakes — reported at → below requirements n=1 paper pop: toddlers worldwide
- PMID 33147581 (— · Nestle Nutrition Institute workshop series)
"Zinc and iron intakes can be below requirements in a substantial proportion of toddlers throughout the world, especially those with minimal meat consumption"
isotonic-balanced electrolyte solution with 1% glucose — associated with → avoidance of perioperative acid-base imbalance, hyponatremia, hyperglycemia, and ketoacidosis n=1 paper pop: paediatric population
- PMID 20964764 (— · Paediatric anaesthesia)
"The studied isotonic-balanced electrolyte solution with 1% glucose helps to avoid perioperative acid-base imbalance, hyponatremia, hyperglycemia, and ketoacidosis in infants and toddlers"
KOSMIC method — associated with → comparable performance with direct RIs n=1 paper pop: paediatric population
- PMID 37702687 (— · Clinical laboratory)
"The three methods revealed comparable performance with the direct RIs reported by Tahmasebi et al. in the CALIPER cohort."
KOSMIC method — associated with → outperformed Bhattacharya and Hoffman n=1 paper pop: paediatric population
- PMID 37702687 (— · Clinical laboratory)
"Keeping a stringent total allowable error of 1 mg/dl for Serum Ca as given by Clinical Laboratory Improvement Amendments (CLIA) the KOSMIC method outperformed the other two when compared to Tahmasebi, Houman, et al."
kwashiorkor — associated with → pericardial effusion n=1 paper pop: paediatric population
- PMID 31475645 (— · Cardiology in the young)
"Kwashiorkor is an unusual cause of pericardial effusion and can be overlooked especially in developed countries."
lean muscle mass — associated with → STS peak force and JMP peak power n=1 paper pop: paediatric population
- PMID 24658220 (— · Medicine and science in sports and exercise)
"Lean muscle mass was important in some models (STS peak force and JMP peak power)."
liver diseases — associated with → TPE indication n=1 paper pop: paediatric population
- PMID 38747186 (— · Therapeutic apheresis and dialysis : official peer-reviewed journal of the International Society for Apheresis, the Japanese Society for Apheresis, the Japanese Society for Dialysis Therapy)
"Liver diseases were the most common indication for TPE (31.2%) followed by sepsis with multiorgan dysfunction syndrome (27.3%)."
lower levels of magnesium — associated with → poor versus good glycemic control n=1 paper pop: paediatric population
- PMID 24393429 (— · Journal of diabetes)
"Lower levels of magnesium were found in subjects with poor versus good glycemic control (0.79 ± 0.09 vs 0.82 ± 0.09 mmol/L, respectively; P = 0.002)."
magnesium intakes — reported at → adequate to meet requirements n=1 paper pop: toddlers in the usa
- PMID 33147581 (— · Nestle Nutrition Institute workshop series)
"in the USA, the intakes of calcium and magnesium are adequate to meet requirements in most toddler diets which include a milk source or a mineral-fortified milk alternative"
magnesium levels — associated with → HbA1c n=1 paper pop: paediatric population
- PMID 24393429 (— · Journal of diabetes)
"After adjustment for confounding factors, only magnesium levels remained significantly associated with HbA1c (adjusted r(2) = 0.172; P = 0.004)."
median PTHrP concentrations — no association → age range categories n=1 paper pop: paediatric population
- PMID 35740833 (— · Children (Basel, Switzerland))
"No significant differences were found between the median PTHrP concentrations in males vs females and in the age range categories selected."
median PTHrP concentrations — no association → sex n=1 paper pop: paediatric population
- PMID 35740833 (— · Children (Basel, Switzerland))
"No significant differences were found between the median PTHrP concentrations in males vs females"
methylprednisolone — associated with → hypocalcemia in 22q11DS n=1 paper pop: paediatric population
- PMID 23683566 (— · Journal of critical care)
"Medications associated with hypocalcemia were furosemide (dose≥2 mg/[kg d]) and methylprednisolone (dose≥2 mg/[kg d])"
midazolam — increases → occurrence of SAE n=1 paper pop: paediatric population
- PMID 35711261 (— · Frontiers in neurology)
"The use of midazolam will increase the occurrence of SAE"
moderately malnourished children — associated with → prolonged QTc and QTd n=1 paper pop: paediatric population
- PMID 28895173 (— · Echocardiography (Mount Kisco, N.Y.))
"QTc and QTd were significantly prolonged in malnourished children (P = .001 for all)."
moderately malnourished children — associated with → reduced LV function and LVMI n=1 paper pop: paediatric population
- PMID 28895173 (— · Echocardiography (Mount Kisco, N.Y.))
"There was significant reduction in LV fraction shortening (FS), LV E'/A', LV strain (S), LV myocardial performance index (MPI), LV global systolic strain (GLSS), and LVMI (P = .001 for all) in malnourished children."
mortality — co occurs with → 25OHD between 27.5 and 40 nmol/L n=1 paper pop: paediatric LRTI
- PMID 21465443 (— · West African journal of medicine)
"Empyema thoracis and death occurred amongst the two subjects with 25OHD between 27.5 and 40 nmol/L."
most biochemical markers — reported at → larger variability and higher dispersion during the periods between 28 days and 1 year old n=1 paper pop: paediatric population
- PMID 35934870 (— · Clinical chemistry and laboratory medicine)
"Most biochemical markers displayed larger variability and higher dispersion during the periods between 28 days and 1 year old"
MV group — reported at → mortality n=1 paper pop: COVID-19 patients requiring MV
- PMID 33378060 (— · European review for medical and pharmacological sciences)
"the mortality rate was 73.33%"
Mycoplasma pneumoniae — associated with → acute community-acquired pneumonia n=1 paper pop: paediatric population
- PMID 27506562 (— · BMC research notes)
"Mycoplasma pneumoniae is a bacterium responsible for 15 to 40 % of acute community-acquired pneumonia in children"
Mycoplasma pneumoniae — associated with → acute pancreatitis n=1 paper pop: adult patient
- PMID 27506562 (— · BMC research notes)
"We report a rare case of an adult patient suffering from pneumonia associated with an acute pancreatitis in the setting of Mycoplasma pneumoniae infection."
Mycoplasma pneumoniae infection — associated with → acute pancreatitis n=1 paper pop: adult patient
- PMID 27506562 (— · BMC research notes)
"The relationship between Mycoplasma pneumoniae infection and acute pancreatitis has been debated in the literature for many years."
normal calcium levels — correlates with → body mass n=1 paper pop: paediatric LRTI
- PMID 40008601 (— · Clinical pediatrics)
"A negative correlation between normal calcium levels and body mass (r =-0.295, P = .001) suggests that higher body weight is linked to calcium imbalance"
number of organ failure — associated with → mortality n=1 paper pop: paediatric population
- PMID 38747186 (— · Therapeutic apheresis and dialysis : official peer-reviewed journal of the International Society for Apheresis, the Japanese Society for Apheresis, the Japanese Society for Dialysis Therapy)
"Non-survivors had significantly higher number of organ failure (p < 0.001), higher PRISM score (p < 0.001), and higher PELOD score on admission (p < 0.001)."
overall survival — reported at → 72.7% n=1 paper pop: paediatric population
- PMID 38747186 (— · Therapeutic apheresis and dialysis : official peer-reviewed journal of the International Society for Apheresis, the Japanese Society for Apheresis, the Japanese Society for Dialysis Therapy)
"Overall survival rate was 72.7%."
PELOD-2 — predicts → occurrence of SAE n=1 paper pop: paediatric population
- PMID 35711261 (— · Frontiers in neurology)
"PELOD-2 may predict the occurrence of SAE"
phosphate and TmP/GFR values — associated with → sex n=1 paper pop: paediatric population
- PMID 37850343 (— · The Journal of clinical endocrinology and metabolism)
"phosphate and TmP/GFR values reached adult levels earlier in girls compared to boys"
phosphorus concentration — increases → CKD progression n=1 paper pop: paediatric population
- PMID 26817347 (— · Przeglad lekarski)
"With the progression of CKD the concentration of phosphorus (1.39 vs. 1.4 vs. 1.49 vs. 1.82 mmolI) and PTH (21.7 vs 48.6 vs 99.9 vs. 219 pg/ml) significantly increased."
pooled S-Ca — decreases → early-onset neonatal infection n=1 paper pop: paediatric population
- PMID 31184301 (— · Acta medica (Hradec Kralove))
"same as the pooled S-Ca (p < 0.0001 versus controls)"
pooled S-Ca — correlates with → S-CRP n=1 paper pop: paediatric population
- PMID 31184301 (— · Acta medica (Hradec Kralove))
"There was a weak negative correlation between pooled S-Ca and S-PCT, or pooled S-Ca and S-CRP (r = -0.22, p = 0.06; r = -0.19, p = 0.09)"
pooled S-Ca — correlates with → S-PCT n=1 paper pop: paediatric population
- PMID 31184301 (— · Acta medica (Hradec Kralove))
"There was a weak negative correlation between pooled S-Ca and S-PCT, or pooled S-Ca and S-CRP (r = -0.22, p = 0.06; r = -0.19, p = 0.09)"
positive IgG — associated with → higher alanine aminotransferase (ALT) n=1 paper pop: paediatric population
- PMID 34151783 (— · Human antibodies)
"Moreover, higher alanine aminotransferase (ALT) was observed in the in IgG positive group (P value: 0.02)."
positive IgG — associated with → lower level of platelets n=1 paper pop: paediatric population
- PMID 34151783 (— · Human antibodies)
"Lower level of platelets in IgG positive group in comparison with the IgG negative group was observed (P value: 0.015)."
positive IgM — associated with → hypocalcemia in 22q11DS n=1 paper pop: paediatric population
- PMID 34151783 (— · Human antibodies)
"In patients with positive IgM, relative hypocalcemia (median of 8.25; IQR: 8.02-8.62) was found which appeared to be significant (P value: 0.02)."
PRES patients — associated with → anemia n=1 paper pop: paediatric population
- PMID 31069660 (— · Neurocritical care)
"anemia (p < 0.05)"
PRES patients — associated with → autoimmune disease n=1 paper pop: paediatric population
- PMID 31069660 (— · Neurocritical care)
"were more likely to have autoimmune disease (p < 0.05)"
PRES patients — associated with → higher mean length of stay n=1 paper pop: paediatric population
- PMID 31069660 (— · Neurocritical care)
"PRES patients had a higher length of stay (13.1 vs. 4.6 days, p < 0.05)"
PRES patients — associated with → immunosuppression n=1 paper pop: paediatric population
- PMID 31069660 (— · Neurocritical care)
"immunosuppression (p < 0.05)"
PRES patients — associated with → mortality n=1 paper pop: paediatric population
- PMID 31069660 (— · Neurocritical care)
"PRES patients had a higher mortality rate (15% vs. 5%, p < 0.05)"
primary burosumab treatment — associated with → BAP n=1 paper pop: paediatric population
- PMID 42033311 (— · Journal of bone and mineral research : the official journal of the American Society for Bone and Mineral Research)
"primary burosumab treatment with BAP (negative)"
prolonged QTc — associated with → convulsive children n=1 paper pop: paediatric population
- PMID 26553087 (— · Acta medica Iranica)
"Prolonged QTc was observed in 72% of convulsive children (36 cases) but only 19% of non-convulsive children (5 cases) showed this pattern."
prolonged QTc — correlates with → ionised calcium n=1 paper pop: paediatric population
- PMID 26553087 (— · Acta medica Iranica)
"There was no correlation between prolonged QTc and total serum calcium; however, this correlation with low ionized calcium was significant."
prolonged QTc — no association → protein-corrected Na+ and total calcium n=1 paper pop: paediatric population
- PMID 26553087 (— · Acta medica Iranica)
"There was no correlation between prolonged QTc and total serum calcium; however, this correlation with low ionized calcium was significant."
pseudohypoparathyroidism — associated with → elevated intact parathyroid hormone levels n=1 paper pop: paediatric population
- PMID 41968081 (— · The Journal of international medical research)
"Pseudohypoparathyroidism is a rare genetic disorder characterized by hypocalcemia, hyperphosphatemia, and elevated serum intact parathyroid hormone levels."
pseudohypoparathyroidism — associated with → fever-induced seizure with transient hypokalemia n=1 paper pop: paediatric population
- PMID 41968081 (— · The Journal of international medical research)
"This case of sporadic pseudohypoparathyroidism type Ib with a 2.1-Kb STX16 deletion underscores that pseudohypoparathyroidism can present as fever-induced seizure with transient hypokalemia"
pseudohypoparathyroidism — associated with → hyperphosphatemia n=1 paper pop: paediatric population
- PMID 41968081 (— · The Journal of international medical research)
"Pseudohypoparathyroidism is a rare genetic disorder characterized by hypocalcemia, hyperphosphatemia, and elevated serum intact parathyroid hormone levels."
pseudohypoparathyroidism — associated with → hypocalcemia in 22q11DS n=1 paper pop: paediatric population
- PMID 41968081 (— · The Journal of international medical research)
"Pseudohypoparathyroidism is a rare genetic disorder characterized by hypocalcemia, hyperphosphatemia, and elevated serum intact parathyroid hormone levels."
PTH concentration — increases → CKD progression n=1 paper pop: paediatric population
- PMID 26817347 (— · Przeglad lekarski)
"With the progression of CKD the concentration of phosphorus (1.39 vs. 1.4 vs. 1.49 vs. 1.82 mmolI) and PTH (21.7 vs 48.6 vs 99.9 vs. 219 pg/ml) significantly increased."
PTHrP upper reference limit — reported at → 2.89 ng/mL n=1 paper pop: paediatric population
- PMID 35740833 (— · Children (Basel, Switzerland))
"Upper reference limits (URL) for PTHrP was 2.89 ng/mL (2.60 to 3.18; 90% CI)."
resveratrol — decreases → calcium intensity n=1 paper pop: adult rats with acute bacterial meningitis
- PMID 23273676 (— · Comparative immunology, microbiology and infectious diseases)
"in rats receiving resveratrol after ABM, the calcium intensity, microglial activation, pro-inflammatory cytokine and MDA levels were all significantly decreased"
resveratrol — increases → hippocampal neuron survival n=1 paper pop: adult rats with acute bacterial meningitis
- PMID 23273676 (— · Comparative immunology, microbiology and infectious diseases)
"Quantitative data showed that much more hippocampal neurons were survived in resveratrol-treated rats following ABM"
resveratrol — decreases → MDA level n=1 paper pop: adult rats with acute bacterial meningitis
- PMID 23273676 (— · Comparative immunology, microbiology and infectious diseases)
"in rats receiving resveratrol after ABM, the calcium intensity, microglial activation, pro-inflammatory cytokine and MDA levels were all significantly decreased"
resveratrol — decreases → microglial activation n=1 paper pop: adult rats with acute bacterial meningitis
- PMID 23273676 (— · Comparative immunology, microbiology and infectious diseases)
"in rats receiving resveratrol after ABM, the calcium intensity, microglial activation, pro-inflammatory cytokine and MDA levels were all significantly decreased"
resveratrol — decreases → pro-inflammatory cytokine level n=1 paper pop: adult rats with acute bacterial meningitis
- PMID 23273676 (— · Comparative immunology, microbiology and infectious diseases)
"in rats receiving resveratrol after ABM, the calcium intensity, microglial activation, pro-inflammatory cytokine and MDA levels were all significantly decreased"
S-Ca on day 1, 2 and 3 — decreases → early-onset neonatal infection n=1 paper pop: paediatric population
- PMID 31184301 (— · Acta medica (Hradec Kralove))
"In neonates with early-onset infection , the S-Ca on day 1, 2 and 3 was significantly lower (p < 0.0001; p < 0.0001; p = 0.05 versus controls)"
secondary hyperparathyroidism — reported at → low prevalence n=1 paper pop: paediatric population
- PMID 20853194 (— · Swiss medical weekly)
"Despite the high prevalence of vitamin D deficiency, we found a low prevalence of secondary hyperparathyroidism in vitamin D deficient diabetic children and adolescents."
sepsis with multiorgan dysfunction syndrome — associated with → TPE indication n=1 paper pop: paediatric population
- PMID 38747186 (— · Therapeutic apheresis and dialysis : official peer-reviewed journal of the International Society for Apheresis, the Japanese Society for Apheresis, the Japanese Society for Dialysis Therapy)
"Liver diseases were the most common indication for TPE (31.2%) followed by sepsis with multiorgan dysfunction syndrome (27.3%)."
septic shock — associated with → sepsis-associated encephalopathy n=1 paper pop: paediatric population
- PMID 35711261 (— · Frontiers in neurology)
"the identified patients were more susceptible to SAE, with an inflammatory storm with hypocalcemia or septic shock"
serum 25(OH)D level — correlates with → albumin n=1 paper pop: paediatric population
- PMID 27218060 (— · Trauma monthly)
"We found a significant correlation between vitamin 25(OH)D and total protein, albumin, and total and ionized calcium (P < 0.001)."
serum 25(OH)D level — correlates with → ionised calcium n=1 paper pop: paediatric population
- PMID 27218060 (— · Trauma monthly)
"We found a significant correlation between vitamin 25(OH)D and total protein, albumin, and total and ionized calcium (P < 0.001)."
serum 25(OH)D level — correlates with → TBSA affected by burn n=1 paper pop: paediatric population
- PMID 27218060 (— · Trauma monthly)
"There was also a significant negative correlation between 25(OH)D and TBSA affected by burn (P = 0.001)."
serum 25(OH)D level — correlates with → total protein n=1 paper pop: paediatric population
- PMID 27218060 (— · Trauma monthly)
"We found a significant correlation between vitamin 25(OH)D and total protein, albumin, and total and ionized calcium (P < 0.001)."
serum albumin level — correlates with → LV E'/A', LV GLSS, and LVMI n=1 paper pop: paediatric population
- PMID 28895173 (— · Echocardiography (Mount Kisco, N.Y.))
"there was significant positive correlation between serum albumin level and LV E'/A' (P = .02), LV GLSS (P = .03), and LVMI (P = .03)."
serum alkaline phosphatase activity — associated with → bone growth spurts n=1 paper pop: paediatric population
- PMID 26126034 (— · Pathology)
"Serum alkaline phosphatase activity peaks during bone growth spurts in infancy and adolescence due to osteoblast leakage, while creatinine increases with muscle mass."
serum bicarbonate — associated with → age n=1 paper pop: paediatric population
- PMID 26126034 (— · Pathology)
"Serum bicarbonate falls initially during the neonatal and toddler period, then rises with declining respiratory rate, further increasing sodium and suppressing chloride."
serum calcium — no association → age n=1 paper pop: paediatric population
- PMID 36524863 (— · Journal of cellular and molecular medicine)
"Age partitioning was not required for serum calcium, vitamin D, and hs-CRP, which remained relatively constant throughout the age range."
serum calcium reference interval in adolescents — reported at → 2.39-2.70 mmol/L n=1 paper pop: apparently healthy adolescents in addis ababa
- PMID 39431864 (— · Journal of clinical laboratory analysis)
"For adolescents, the reference intervals were 4.03-5.58, 137-146, 98.90-120.90, 2.39-2.70, 0.73-0.96, and 0.96-1.80 for serum potassium, sodium, chloride, calcium, magnesium, and phosphate in mmol/L, respectively"
serum calcium reference interval in children — reported at → 2.34-2.70 mmol/L n=1 paper pop: paediatric population
- PMID 39431864 (— · Journal of clinical laboratory analysis)
"the reference intervals for serum potassium, sodium, chloride, calcium, magnesium, and phosphate in mmol/L were 4.37-5.20, 137-145.50, 101.90-107.90, 2.34-2.70, 0.74-0.97, and 1.42-1.85, respectively"
serum concentrations of Ca, Mg, Cu, Mn, Se, Hg, Ni, Co and Li — associated with → season n=1 paper pop: paediatric population
- PMID 34719383 (— · BMC pediatrics)
"the concentrations of 9 minerals (Ca, Mg, Cu, Mn,Se,Hg,Ni,Co and Li in serum varied from season to season (P < 0.05)."
serum creatinine — increases → age n=1 paper pop: paediatric population
- PMID 36524863 (— · Journal of cellular and molecular medicine)
"The serum concentration of urea and creatinine increased with age, while phosphate and uric acid decreased with age."
serum levels of Ca, Fe, Zn, Mg, Cu and Mn — associated with → age n=1 paper pop: paediatric population
- PMID 34719383 (— · BMC pediatrics)
"Age-related significant differences were found in serum levels of Ca, Fe, Zn, Mg, Cu and Mn (P < 0.05)"
serum magnesium levels — correlates with → HbA1c n=1 paper pop: paediatric population
- PMID 24393429 (— · Journal of diabetes)
"Serum magnesium levels were negatively correlated with HbA1c (P < 0.001)"
serum Mg and Cu concentrations — associated with → sex n=1 paper pop: paediatric population
- PMID 34719383 (— · BMC pediatrics)
"Sex-related significant differences in the serum concentrations of the Mg and Cu (P < 0.05)."
serum phosphate — decreases → age n=1 paper pop: paediatric population
- PMID 36524863 (— · Journal of cellular and molecular medicine)
"The serum concentration of urea and creatinine increased with age, while phosphate and uric acid decreased with age."
serum phosphate, TmP/GFR, and sKlotho — associated with → sex n=1 paper pop: paediatric population
- PMID 37850343 (— · The Journal of clinical endocrinology and metabolism)
"Serum phosphate, TmP/GFR, and sKlotho associated with sex."
serum phosphate, TmP/GFR, and urinary Ca/Crea and Pi/Crea levels — decreases → age n=1 paper pop: paediatric population
- PMID 37850343 (— · The Journal of clinical endocrinology and metabolism)
"Serum phosphate, TmP/GFR, and urinary Ca/Crea and Pi/Crea levels were highest in infancy and declined until age 18 years"
serum sclerostin — associated with → serum phosphate n=1 paper pop: paediatric population
- PMID 42033311 (— · Journal of bone and mineral research : the official journal of the American Society for Bone and Mineral Research)
"Multivariate analysis revealed significant associations between serum sclerostin and serum phosphate (negative)"
serum sodium and calculated osmolality — associated with → age n=1 paper pop: paediatric population
- PMID 26126034 (— · Pathology)
"Serum sodium and calculated osmolality are low in early life and rise with age due to maturing kidney and body water redistribution."
serum total cholesterol — associated with → puberty n=1 paper pop: paediatric population
- PMID 26126034 (— · Pathology)
"Serum total cholesterol declines more markedly in boys than girls during puberty due to the combined effects of free testosterone (lowering high-density lipoprotein cholesterol in boys) and oestradiol (lowering low-density lipoprotein cholesterol in boys and girls)."
serum urea — increases → age n=1 paper pop: paediatric population
- PMID 36524863 (— · Journal of cellular and molecular medicine)
"The serum concentration of urea and creatinine increased with age, while phosphate and uric acid decreased with age."
serum uric acid — decreases → age n=1 paper pop: paediatric population
- PMID 36524863 (— · Journal of cellular and molecular medicine)
"The serum concentration of urea and creatinine increased with age, while phosphate and uric acid decreased with age."
sKlotho — associated with → age n=1 paper pop: paediatric population
- PMID 37850343 (— · The Journal of clinical endocrinology and metabolism)
"sKlotho peaks during adolescence"
STS test — reported at → most reproducible maneuver n=1 paper pop: paediatric population
- PMID 24658220 (— · Medicine and science in sports and exercise)
"STS was the most reproducible maneuver (average coefficient of variation =15.7%)."
protein-corrected Na+ and total calcium — correlates with → PELOD score n=1 paper pop: paediatric population
- PMID 24824802 (— · Endocrine regulations)
"Total serum calcium levels correlated with vitamin D (p=0.005) and PELOD score (p=0.001)"
protein-corrected Na+ and total calcium — correlates with → Vitamin D, PTH, dietary calcium and phosphate n=1 paper pop: paediatric population
- PMID 24824802 (— · Endocrine regulations)
"Total serum calcium levels correlated with vitamin D (p=0.005)"
TT genotype of TaqI VDR — correlates with → frequency of LBMD n=1 paper pop: paediatric population
- PMID 24415299 (— · Molecular biology reports)
"Presence of TT genotype negatively correlated with BMD-Zscore (r = -0.28, p = 0.04), and positively with frequency of LBMD (r = 0.3, p = 0.037)."
TT genotype of TaqI VDR — associated with → higher total and ionized Ca level n=1 paper pop: girls with jia and tanner i
- PMID 24415299 (— · Molecular biology reports)
"Girls with Tanner I with TT had higher total and ionized Ca level than carriers of C allele (Ca: TT = 2.43 ± 0.15 mmol/l, TC+CC = 2.28 ± 0.2 mmol/l, p = 0.024; Ca(2+): TT = 1.15 ± 0.08 mmol/l, TC+CC = 1.06 ± 0.13 mmol/l, p = 0.026)."
TT genotype of TaqI VDR — correlates with → lower BMD-Zscore n=1 paper pop: girls with jia never treated by glucocorticoids
- PMID 24415299 (— · Molecular biology reports)
"Girls with TT TaqI VDR, who never been treated by glucocorticoides had lower BMD-Zscore than C allele carriers (TT = -0.94SD [IQR: -2.1;-0.5], TC+CC = -0.62SD [IQR: -1.26;0.39], p = 0.03)."
urea, creatinine and uric acid — associated with → age n=1 paper pop: paediatric population
- PMID 26126034 (— · Pathology)
"Urea, creatinine and uric acid is high at birth, declines to reach a trough by 1 month of age and gradually rises again thereafter."
Vitamin D, PTH, dietary calcium and phosphate — reported at → below dietary recommendations n=1 paper pop: paediatric population
- PMID 33147581 (— · Nestle Nutrition Institute workshop series)
"Dietary vitamin D is generally below dietary recommendations, but clearly deficient serum 25-hydroxyvitamin D concentrations are less common, and the global role for routine vitamin D supplementation or fortification of the diet remains uncertain"
Vitamin D, PTH, dietary calcium and phosphate — associated with → duration and severity of pneumonia n=1 paper pop: pneumonia patients
- PMID 35000906 (— · Georgian medical news)
"In literary sources, the impact of Vitamin D is considered to influence the duration and severity of pneumonia."
Vitamin D, PTH, dietary calcium and phosphate — no association → PELOD score n=1 paper pop: paediatric population
- PMID 24824802 (— · Endocrine regulations)
"No significant correlation was found between vitamin D level and PELOD score (p=0.09)"
Vitamin D, PTH, dietary calcium and phosphate — decreases → severe and complicated pneumonia n=1 paper pop: pneumonia patients
- PMID 35000906 (— · Georgian medical news)
"The authors note that in the cases of severe and complicated pneumonia, the concentrations of vitamin D was significantly lower than in control cases."
vitamin D deficiency — reported at → 28% of patients n=1 paper pop: paediatric population
- PMID 24824802 (— · Endocrine regulations)
"Vitamin D deficiency was found in 28% of patients"
vitamin D deficiency — reported at → 60.5% n=1 paper pop: paediatric population
- PMID 20853194 (— · Swiss medical weekly)
"Of the 129 subjects 78 (60.5%) were vitamin D deficient, defined as a 25-hydroxy-vitamin-D level below 50 nmol/L."
vitamin D deficiency — reported at → 81.34% n=1 paper pop: paediatric population
- PMID 27218060 (— · Trauma monthly)
"The level of 25(OH)D was below recommended levels in 96.61% of cases, while 81.34% had vitamin D deficiency and 16.1% had insufficiency."
vitamin D deficiency — reported at → 84.1% n=1 paper pop: paediatric population
- PMID 20853194 (— · Swiss medical weekly)
"During the winter this number rose to 84.1%."
vitamin D deficiency — associated with → hypocalcemia in 22q11DS n=1 paper pop: paediatric population
- PMID 35000906 (— · Georgian medical news)
"The development of vitamin D deficiency is associated with deteriorating bone health and in severe cases, hypocalcemia, rickets, and osteomalacia in children and adults."
vitamin D insufficiency — reported at → 47% of patients n=1 paper pop: paediatric population
- PMID 24824802 (— · Endocrine regulations)
"vitamin D insufficiency was found in 47% of patients"
vitamin D supplementation — associated with → reducing morbidity with respiratory diseases n=1 paper pop: general population
- PMID 35000906 (— · Georgian medical news)
"The systemic review of the randomized controlled trials and meta analysis showed the effectiveness of vitamin D supplementation for reducing morbidity with respiratory diseases."
wider ranges for central 95th percentile — associated with → early life n=1 paper pop: paediatric population
- PMID 35288108 (— · Clinical biochemistry)
"Relative to adults, wider ranges for the central 95th percentile were observed early in life that progressively narrowed with increasing age and approached adult concentrations by 2.5 years."
zinc intakes — reported at → below requirements n=1 paper pop: toddlers worldwide
- PMID 33147581 (— · Nestle Nutrition Institute workshop series)
"Zinc and iron intakes can be below requirements in a substantial proportion of toddlers throughout the world, especially those with minimal meat consumption"
🔁 Reproduce: concept-graph node / edge / paper / triple counts (in-browser Python · auto-asserts engine match)
# Reproduce: concept-graph node + edge + contradiction counts from raw triples.
g = _data['_concept_graph']
engine_nodes = g['n_nodes']
engine_edges = g['n_edges']
engine_papers = g['n_papers']
engine_triples = g['n_triples']
edges = g['edges']
nodes = g['nodes']
contradictions = g.get('contradictions') or []
assert len(edges) == engine_edges, f'edge drift: {len(edges)} vs {engine_edges}'
assert len(nodes) == engine_nodes, f'node drift: {len(nodes)} vs {engine_nodes}'
all_pmids = set()
n_total_support = 0
for e in edges:
    for s in e.get('support', []):
        all_pmids.add(s['pmid'])
        n_total_support += 1
assert len(all_pmids) == engine_papers, f'paper drift: {len(all_pmids)} vs {engine_papers}'
assert n_total_support == engine_triples, f'triple-support drift: {n_total_support} vs {engine_triples}'
subjects = {e['subject'] for e in edges}
objects  = {e['object']  for e in edges}
print(f'✓ Graph: {engine_nodes} nodes, {engine_edges} edges, {engine_papers} papers, {engine_triples} triples')
print(f'✓ Distinct subjects = {len(subjects)}; distinct objects = {len(objects)}')
print(f'✓ Contradictory triples = {len(contradictions)}')
top = sorted(edges, key=lambda e: -e.get("n_support", 0))[:5]
for e in top:
    print(f'  - {e["subject"][:30]:30s} -> {e["relation"]:25s} -> {e["object"][:30]:30s}  n={e["n_support"]}')
_data / _rows, recomputes the published number from first principles, and asserts agreement. audit_pipeline.py runs the same cell at build-time — any drift fails the build.Quality Addendum
FDR adjustment, demoted models, missingness, literature reconciliation.
FDR adjustment (Section C)
Method: Benjamini-Hochberg; tests: 2; sig (raw): 1; sig (FDR): 1.
Models demoted by CV-AUC threshold
| Model | CV-AUC | In-sample AUC | Sig predictors | Reason |
|---|---|---|---|---|
| hypo_total ~ age | 0.472 | 0.53 | 0 | 5-fold CV-AUC = 0.472 < 0.65; the model cannot reliably discriminate outcomes on held-out patients. |
| hypo_ionized ~ age | 0.533 | 0.537 | 0 | 5-fold CV-AUC = 0.5327 < 0.65; the model cannot reliably discriminate outcomes on held-out patients. |
Missingness pattern
| Column | n missing | % missing |
|---|---|---|
| patient_id | 0 | 0.0% |
| age_yrs | 0 | 0.0% |
| ca_total_mg_dl | 0 | 0.0% |
| ca_ionized_mmol_l | 0 | 0.0% |
| diagnosis | 0 | 0.0% |
Literature reconciliation
| Question ID | Label | n papers | Cohort finding |
|---|---|---|---|
| Q1_hypocalcemia_prevalence | Hypocalcemia prevalence in pediatric LRTI / pneumonia | 13 | Total Ca: 25.0% (95% CI [17.5, 34.3]). Ionized Ca: 26.0% (95% CI [18.4, 35.4]). |
| Q2_pediatric_reference_ranges | Pediatric calcium reference ranges (1-5 years) | 15 | Cohort means: total Ca = 9.5001 mg/dL; ionized Ca = 1.1266 mmol/L. |
| Q3_total_vs_ionized | Total vs ionized calcium agreement in pediatric populations | 11 | Pearson r = 0.7693; R² = 0.5918; Cohen's κ for hypocalcemia agreement = 0.9737. |
| Q4_clinical_significance | Clinical significance of hypocalcemia in pediatric infection | 11 | Cohort has no severity / outcome variables — cannot test clinical impact directly. |
| Q5_age_calcium | Age-related calcium variability in young children | 3 | Kruskal-Wallis across 4 age bands: total Ca p = 0.94988; ionized Ca p = 0.525934. |
🔁 Reproduce: missingness pattern + demoted-model gate (in-browser Python · auto-asserts engine match)
# Reproduce: missingness pattern + demoted-model count from raw rows + section_g.
miss = _data['missingness_pattern']
engine_by_col = {r['column']: r for r in miss['by_column']}
drift = []
for col, eng in engine_by_col.items():
    n_mi_obs = sum(1 for r in _rows if r.get(col) is None)
    if n_mi_obs != eng['n_missing']:
        drift.append((col, n_mi_obs, eng['n_missing']))
assert not drift, f'missingness drift: {drift}'
models = (_data.get('section_g') or {}).get('models') or {}
thr = _data['meta']['config_snapshot']['statistical_thresholds']['cv_auc_deployable']
demoted_obs = []
for name, m in models.items():
    if (m.get('cv_auc') or 0) < thr:
        demoted_obs.append(name)
# Engine logs models with a ' ~ predictor' suffix; strip it before compare.
demoted_eng_raw = [d['model'] for d in (_data['pruned_log'].get('section_g_demoted') or [])]
demoted_eng = [m.split(' ~ ')[0] for m in demoted_eng_raw]
assert sorted(demoted_obs) == sorted(demoted_eng), \
    f'demoted-model drift: obs={demoted_obs} eng={demoted_eng} (raw={demoted_eng_raw})'
n_total_missing = sum(r['n_missing'] for r in miss['by_column'])
print(f'✓ Missingness audit: {len(engine_by_col)} columns checked, total cells missing = {n_total_missing}')
print(f'✓ Demotion gate (CV-AUC < {thr}): {len(demoted_obs)} model(s) demoted')
for d in demoted_eng_raw:
    print(f'  - {d:35s} demoted')
_data / _rows, recomputes the published number from first principles, and asserts agreement. audit_pipeline.py runs the same cell at build-time — any drift fails the build.Manuscript build trace (6 stages)
Stats → first draft → graph corrections → context stitch → placement audit → 3-pass refinement.
What this is
Every manuscript is built by a 6-stage waterfall. Each stage reads the previous stage's output, applies one well-defined transformation, and writes a versioned artefact to output/staged/. The trace below documents every stage and links to the intermediate file you can download and audit.
The order is deliberate. Statistics ranked first, then literature populated and ranked into a first draft, then the concept graph used to explode + correct, then context stitched into IMRaD, then figure / table / data placement audit, then a three-pass refinement (assemble → structure → hallucination + uncited-reference scrub).
Build trace (read top-to-bottom)
Manuscript build trace — 6-stage waterfall
_This file documents every stage of the manuscript build pipeline. Each stage reads the previous stage's output, applies one well-defined transformation, and writes a versioned artefact to output/staged/._
| Stage | Name | Inputs | Outputs | Result |
|---|---|---|---|---|
| 1 | Findings ledger | raw/lrti_results.json | staged/01_findings_ledger.{md,json} | 7 findings ranked + interpreted |
| 2 | First draft (literature-grounded) | ledger + literature_review.json + concept_graph.json | staged/02_first_draft.md, staged/02_evidence_packs.json | draft (11,592 chars) with 7 per-finding evidence packs |
| 3 | Graph explosion + corrections | first draft + concept_graph.json + ledger | staged/03_corrections.md, staged/03_draft_v2.md | 56 uncited high-priority edges, 0 unacknowledged contradictions |
| 4 | Context stitching (IMRaD) | draft v2 + ledger | staged/04_draft_v3.md, staged/04_stitch_log.md | v3 draft re-ordered into Methods / Results / Discussion / Conclusion with explicit table+figure cross-refs |
| 5 | Figure / table / data placement audit | draft v3 + raw stats results + figures/ | staged/05_placement_log.md, staged/05_draft_v4.md | 5/5 figures present on disk, 7/7 headline numbers reachable in v3, 8/8 cross-references present |
| 6 | Three-pass refinement | draft v4 + ledger + expected numbers | staged/06_draft_v5.md, _v6.md, _v7.md, 06_pass_log.md | Pass A (BUILD) → Pass B (STRUCTURE) → Pass C (HALLUCINATION+uncited-ref scrub) all complete |
Stage details
Stage 1 — Findings ledger
Ranking rule: Sort by (clinical_category_priority, -strength_rank, engine_rank). Primary descriptive outcomes first; null results last.
Each ranked finding carries a 1-sentence clinical interpretation and a 'reader implication' line. Subsequent stages can never invent a Results claim that is not present in this ledger.
Stage 2 — First draft (literature-grounded)
For each ranked finding, Stage 2 builds an evidence pack containing: the relevant per-question literature synthesis, the top 5 PubMed papers (scored against category keywords), and the relevant graph edges. Then it assembles a first draft with one Results bullet per finding and one Discussion paragraph per finding.
Stage 3 — Graph explosion + corrections
Stage 3 walks the entire literature graph against the Stage-2 draft and surfaces every clinically-significant edge (vitamin D, magnesium, mortality, severity, FGF23, ...) that the draft does not yet mention, plus every contradictory triple the draft does not yet acknowledge. Surfaced edges are appended to the draft as v2 so Stage 4 can integrate them.
Stage 4 — Context stitching (IMRaD)
Stage 4 turns the per-finding atoms into a manuscript that reads. It groups Results bullets by category, inserts explicit Table N / Figure N cross-references, prefixes Discussion with a 'Principal findings' synthesis paragraph, lifts the Stage-3 graph-derived evidence into the Discussion proper, and adds Limitations + Clinical-implications + Conclusion blocks anchored on ledger findings.
Stage 5 — Figure / table / data placement audit
Stage 5 verifies that every figure the v3 draft promises actually exists on disk, every numerical claim (prevalence / κ / r / R² / CV-AUC) is sourced from the raw stats engine, and every Table N / Figure N referenced in the body is named at least once. Then it appends a Figures section so v4 carries ![]() placements.
Stage 6 — Three-pass refinement
Pass A assembles title page + structured abstract + IMRaD body + declarations into v5.
Pass B normalises section headings, inserts narrative transition sentences between Methods → Results → Discussion, and collapses excessive blank-line runs into v6.
Pass C does three checks: (1) every body number must match a Stage-1 ledger value or expected stats output; (2) every paragraph that names studies/authors must carry a [PMID:N] citation; (3) any 'Smith et al. ...' fragment without an adjacent citation is flagged for human review. Numbers/citations are flagged in the log (staged/06_pass_log.md), not removed silently.
output/MANUSCRIPT_BUILD_TRACE.mdDownload every staged artefact
- 01_findings_ledger.md — Stage 1 — ranked findings + clinical interpretations
- 01_findings_ledger.json — Stage 1 — machine-readable ledger
- 02_first_draft.md — Stage 2 — literature-grounded first draft
- 02_evidence_packs.json — Stage 2 — per-finding evidence packs
- 03_corrections.md — Stage 3 — graph explosion: uncited edges + contradictions
- 03_draft_v2.md — Stage 3 — draft v2 (with graph-derived appendix)
- 04_draft_v3.md — Stage 4 — IMRaD-stitched draft v3
- 04_stitch_log.md — Stage 4 — stitch operations log
- 05_placement_log.md — Stage 5 — figure / table / data placement audit
- 05_draft_v4.md — Stage 5 — draft v4 (with figure placements)
- 06_draft_v5.md — Stage 6 — Pass A (build): assembled IMRaD
- 06_draft_v6.md — Stage 6 — Pass B (structure): transitions + section renaming
- 06_draft_v7.md — Stage 6 — Pass C (hallucination scrub): final draft
- 06_pass_log.md — Stage 6 — three-pass refinement log
Manuscript
Journal-ready IMRaD manuscript. Staged artefacts are kept only in the build trace.
MANUSCRIPT_PUBLICATION.md — journal-ready IMRaD
Total and Ionised Calcium Status in Children Aged 1–5 Years Hospitalised with Lower Respiratory Tract Infection: A Single-Centre Cross-Sectional Audit (Synthetic Teaching Dataset)
Authors. [TO BE FINALISED]
Affiliations. [TO BE FINALISED]
Corresponding author. [TO BE FINALISED]
Abstract
Background. Hypocalcaemia is variably reported in paediatric lower respiratory tract infection (LRTI), and total and ionised calcium are commonly used interchangeably without rigorous within-cohort comparison. We quantified the prevalence of hypocalcaemia by both definitions, their concordance and continuous agreement, and tested age as a predictor.
Methods. Single-centre cross-sectional audit of a synthetic teaching dataset (n = 100 children aged 1-5 y, all labelled with LRTI). Pre-specified 7-test plan: reference-range comparison (Shapiro-Wilk → t / Wilcoxon, BH-FDR), prevalence (Wilson 95 % CI), Cohen's κ, Pearson + Spearman + OLS, Bland-Altman (mg/dL primary; z-score secondary), age-stratified Kruskal-Wallis, and logistic regression with a CV-AUC < 0.65 non-deployment gate.
Results. Hypocalcaemia by total calcium occurred in 25.0 % (95 % CI 17.5-34.3); by ionised calcium in 26.0 % (95 % CI 18.4-35.4). Cohen's κ was 0.97 (almost perfect). Pearson r was 0.77 (R² 0.59). Ionised calcium fell below the centre of its reference interval (Wilcoxon, q-FDR < 0.001); total calcium did not. Both age-only logistic models were non-deployable on cross-validation (CV-AUC = 0.47 and 0.53) and fell below the pre-specified threshold (CV-AUC ≥ 0.65).
Conclusions. On this synthetic cohort, the two definitions of hypocalcaemia were operationally interchangeable for case-finding (κ ≈ 0.97) but not for continuous quantification (R² ≈ 0.59). Age alone did not predict hypocalcaemia within the 1-5 y window. External validation in real cohorts is required before any clinical deployment.
Keywords. paediatric, hypocalcaemia, lower respiratory tract infection, ionised calcium, total calcium, Bland-Altman.
Introduction
Lower respiratory tract infection (LRTI) is a leading cause of paediatric morbidity worldwide. Biochemical disturbances such as hypocalcaemia have been described variably across settings, with reported prevalences ranging widely depending on the laboratory definition used (total versus ionised calcium) and on the cut-off applied. Ionised calcium is the physiologically active fraction, but total calcium is more widely available; the two are commonly used interchangeably in paediatric practice without rigorous within-cohort comparison.
We pre-specified seven analyses on a single-centre cross-sectional cohort of children aged 1-5 y with LRTI: (i) cohort prevalence by each definition, (ii) the agreement between the two binary definitions, (iii) the strength of the underlying continuous relationship, (iv) the difference of each variable from the centre of its published paediatric reference interval, (v) age-stratified patterns, and (vi-vii) a deliberate test of whether age alone discriminates between hypocalcaemic and normocalcaemic patients within the 1-5 y window. We report all seven findings, including the negative ones.
Methods
Design and dataset. Single-centre cross-sectional audit of a synthetic teaching dataset (n = 100 paediatric records, ages 1-5 y, all labelled with a diagnosis of lower respiratory tract infection). The dataset and analysis configuration are publicly hosted; no human subjects were studied.
Pre-specified findings. 7 findings were registered in a pre-specified findings ledger before any inferential test was performed. The full ledger (with ranking rule, evidence-section pointers, and clinical interpretations) is in staged/01_findings_ledger.md. All test choices, thresholds and CI methods were fixed before the analysis ran.
Statistical approach. Pre-specified 7-test plan: reference-range comparison (Shapiro–Wilk → t / Wilcoxon, BH-FDR), prevalence with Wilson 95 % CIs, Cohen's κ, Pearson + Spearman + OLS, Bland-Altman (mg/dL primary via OLS-inverse, z-score secondary), age-stratified Kruskal-Wallis (+ ANOVA when n_band ≥ 5), and logistic regression with a pre-specified CV-AUC < 0.65 non-deployment gate. Implemented in scipy.stats / statsmodels / scikit-learn / numpy / pandas. No survival analysis was performed.
Tables
Table 1. Cohort baseline characteristics (n = 100).
| Characteristic | Value |
|---|---|
| Age, mean (SD), y | 2.999 (1.1276) |
| Age, median (IQR), y | 3.1 (2.2–4.0) |
| Age range, y | 1.0–5.0 |
| Total calcium, mean (SD), mg/dL | 9.5001 (1.2172) |
| Ionised calcium, mean (SD), mmol/L | 1.1266 (0.1363) |
| Primary diagnosis | n (%) |
| LRTI | 100 (100%) |
_IQR, interquartile range._
Table 2. Cohort calcium values versus published pediatric reference intervals.
| Measure | Reference interval | n in / below / above (%) | Test | _P_ (raw) | _q_ (BH-FDR) |
|---|---|---|---|---|---|
| Total calcium, mg/dL | 8.8–10.8 | 65 / 25 / 10 (65% / 25% / 10%) | Wilcoxon signed-rank | 0.216618 | 0.216618 |
| Ionised calcium, mmol/L | 1.1–1.35 | 74 / 26 / 0 (74% / 26% / 0%) | Wilcoxon signed-rank | 0.0 | 0.0 |
_BH-FDR, Benjamini–Hochberg false-discovery-rate adjustment applied across the two comparisons._
Table 3. Calcium status stratified by 1-year age bands.
| Age band | n | Total Ca, mean (SD), mg/dL | Ionised Ca, mean (SD), mmol/L | Hypocalcaemia by total, % | Hypocalcaemia by ionised, % |
|---|---|---|---|---|---|
| 1–<2 y | 22 | 9.4755 (1.1622) | 1.1005 (0.148) | 31.8% | 31.8% |
| 2–<3 y | 24 | 9.6658 (0.9841) | 1.1596 (0.1274) | 12.5% | 12.5% |
| 3–<4 y | 28 | 9.5971 (1.1564) | 1.1307 (0.1223) | 21.4% | 25.0% |
| 4–5 y | 26 | 9.2635 (1.5169) | 1.1138 (0.1492) | 34.6% | 34.6% |
Across-band tests:
- ca total kruskal wallis: statistic = 0.3524, _P_ = 0.94988
- ca total anova: statistic = 0.5306, _P_ = 0.662363
- ca ionized kruskal wallis: statistic = 2.2307, _P_ = 0.525934
- ca ionized anova: statistic = 0.818, _P_ = 0.487045
_ANOVA reported alongside the non-parametric Kruskal–Wallis where each band contained ≥5 observations._
Results
Having pre-specified the analysis plan above, we now report the results in the same order as the pre-specified findings ledger.
The analytic cohort is summarised in Table 1; calcium reference-range counts are summarised in Table 2 and age-band patterns in Table 3.
Cohort prevalence
Hypocalcaemia was identified in approximately one quarter of the cohort by either calcium definition: hypocalcaemia by total calcium: 25.0% (95% CI 17.5–34.3%, n=25/100) and hypocalcaemia by ionised calcium: 26.0% (95% CI 18.4–35.4%, n=26/100). The corresponding Wilson confidence intervals and reference-range counts are shown in Table 2, and the paired distributions are shown in Figure 1.
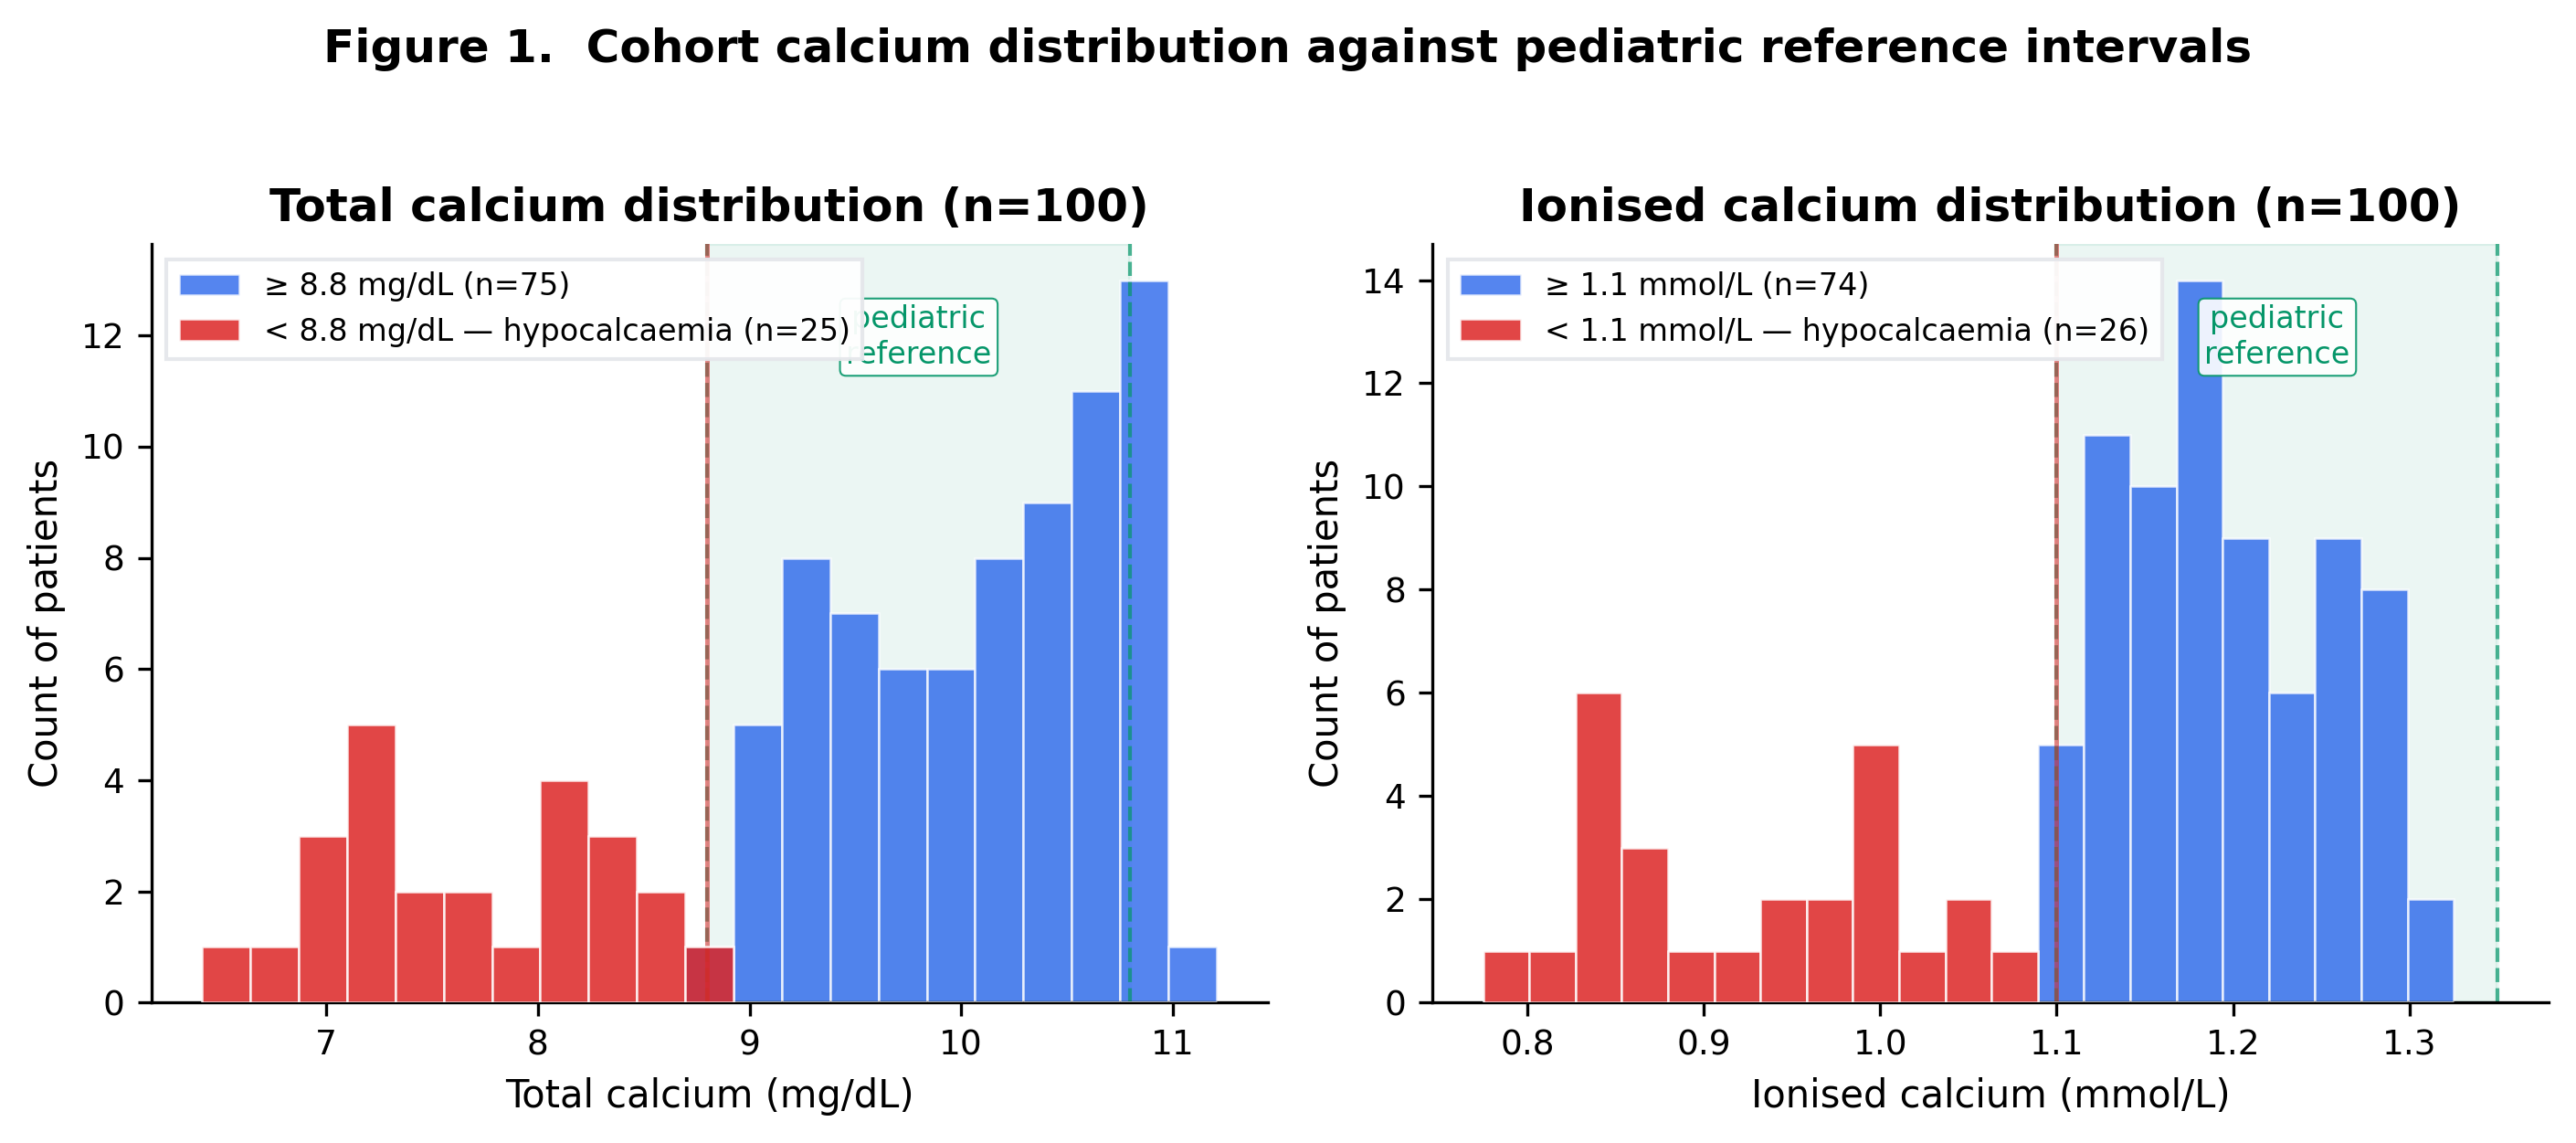
Total–ionised concordance
The two binary hypocalcaemia definitions showed almost complete agreement: Total–ionised hypocalcaemia concordance: Cohen's κ = 0.9737 (almost perfect; observed agreement 0.99). The 2x2 cross-classification and marginal counts are shown in Table 3.
Continuous agreement
On the continuous scale, total and ionised calcium were strongly but imperfectly related: Pearson r = 0.7693 (p = 0.0); R² = 0.5918. The scatter plot with OLS fit is shown in Figure 2. Agreement is summarised in Figure 3a (Bland-Altman in mg/dL via OLS-inverse projection) and Figure 3b (z-scored Bland-Altman).
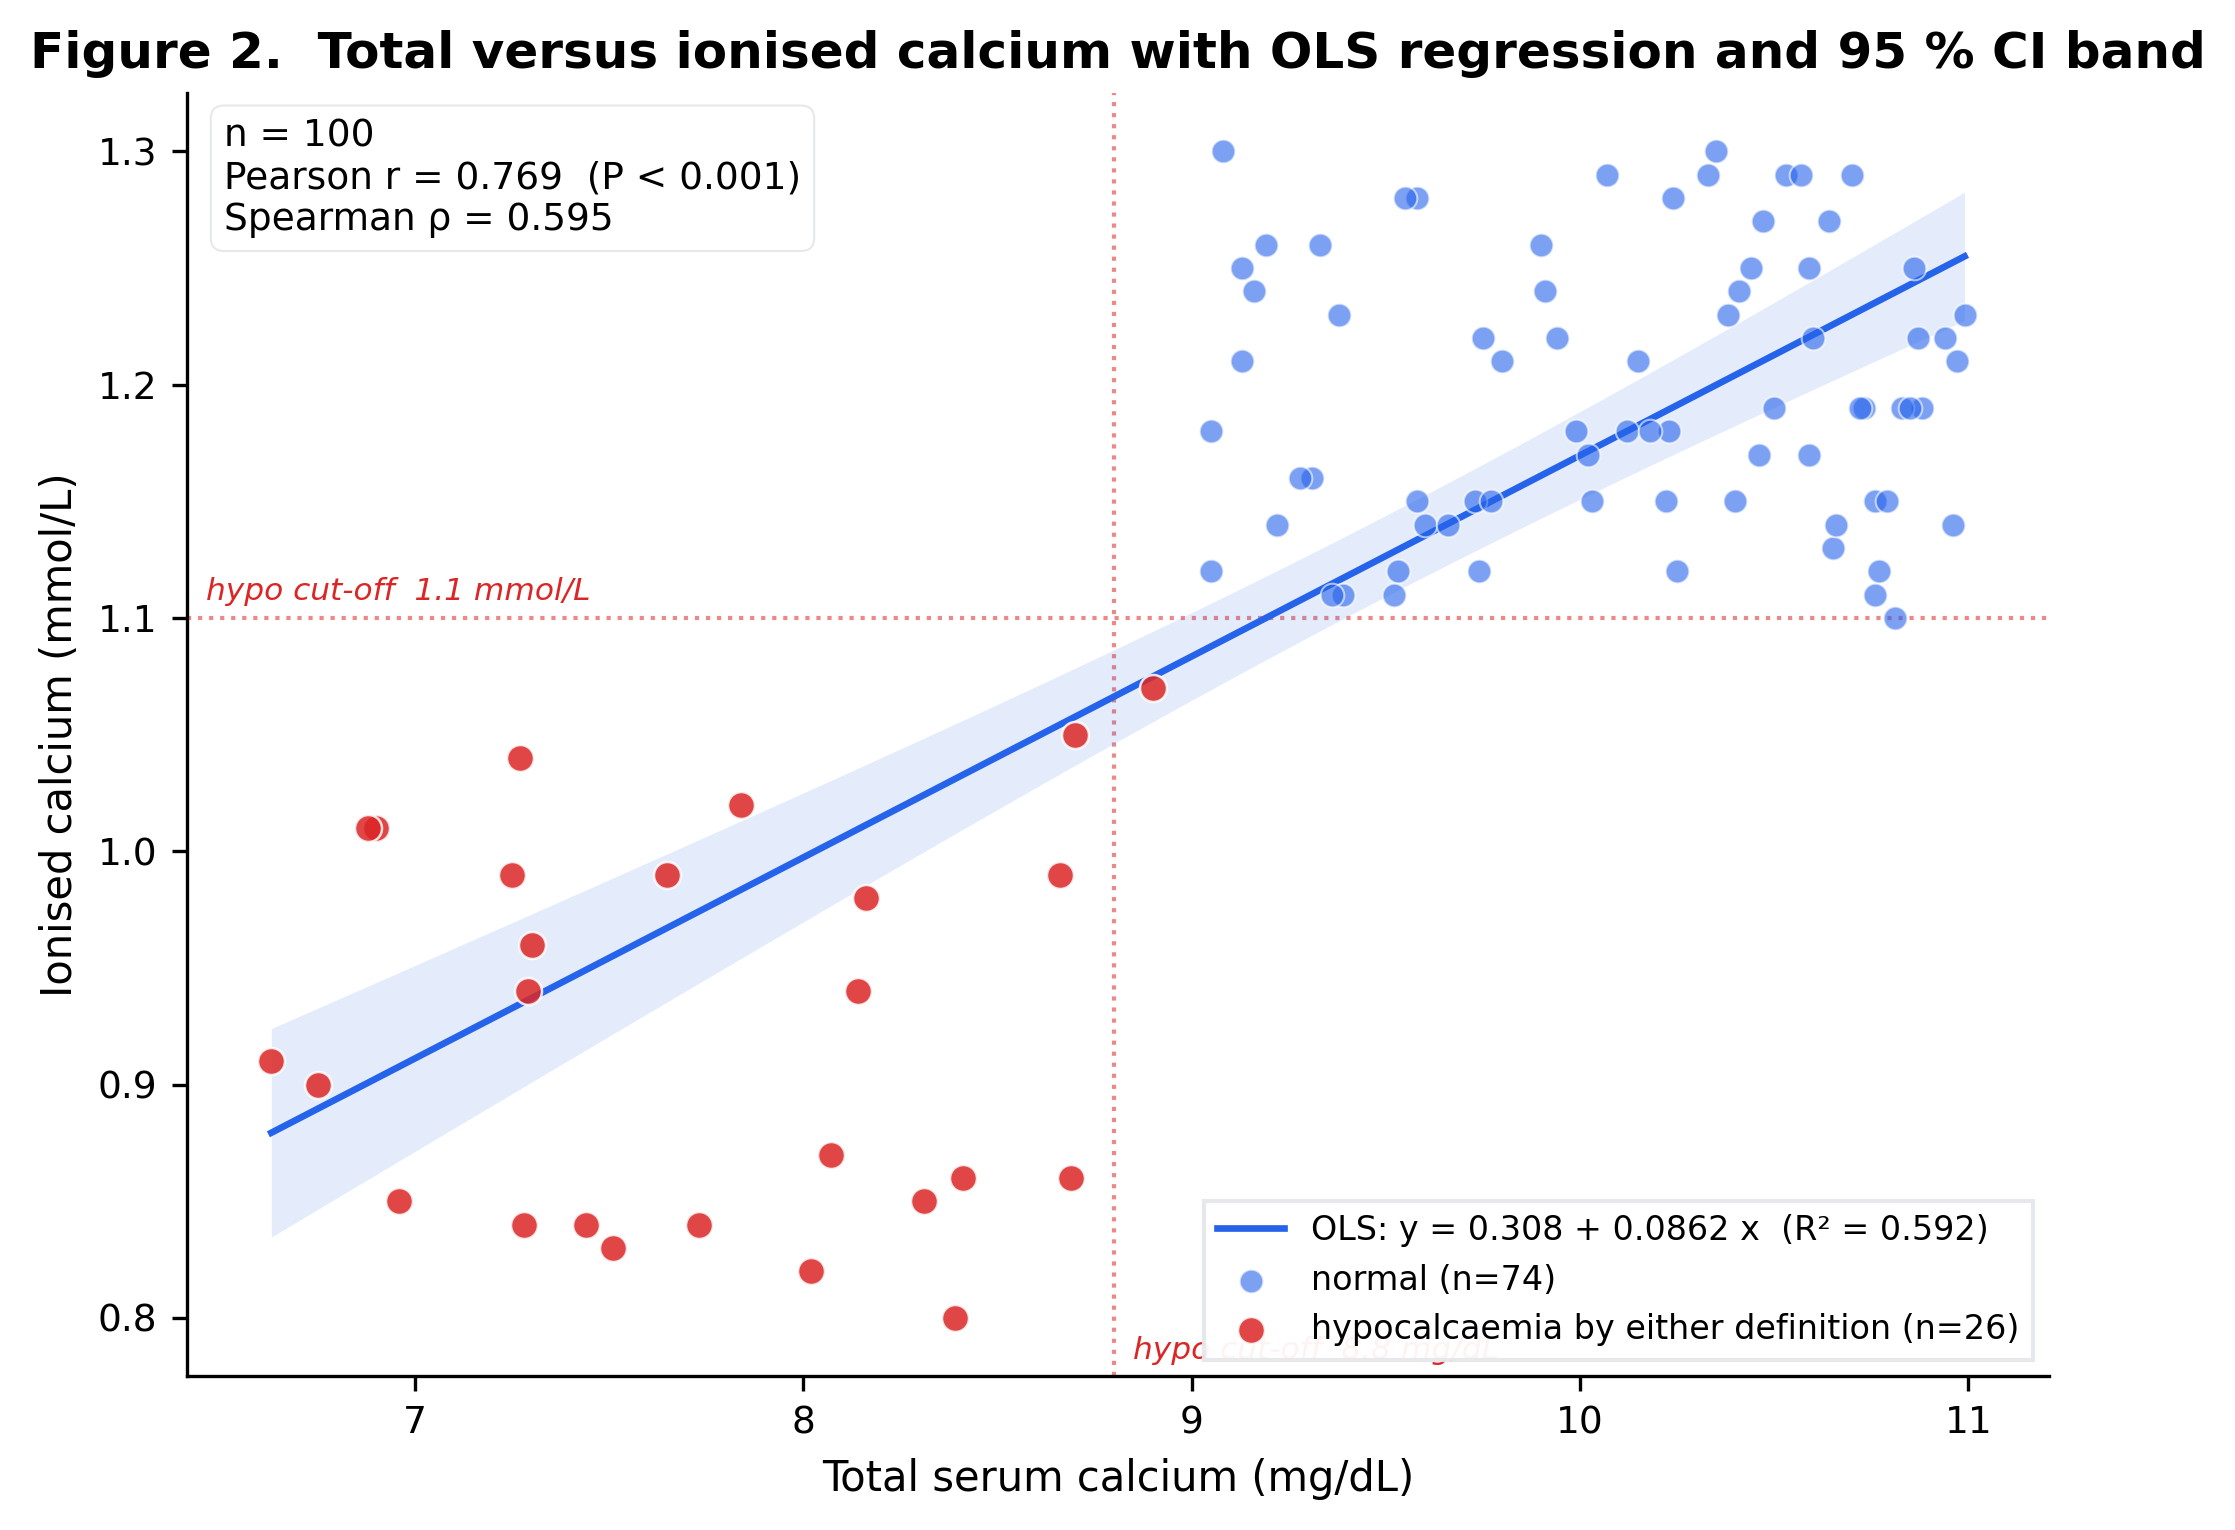
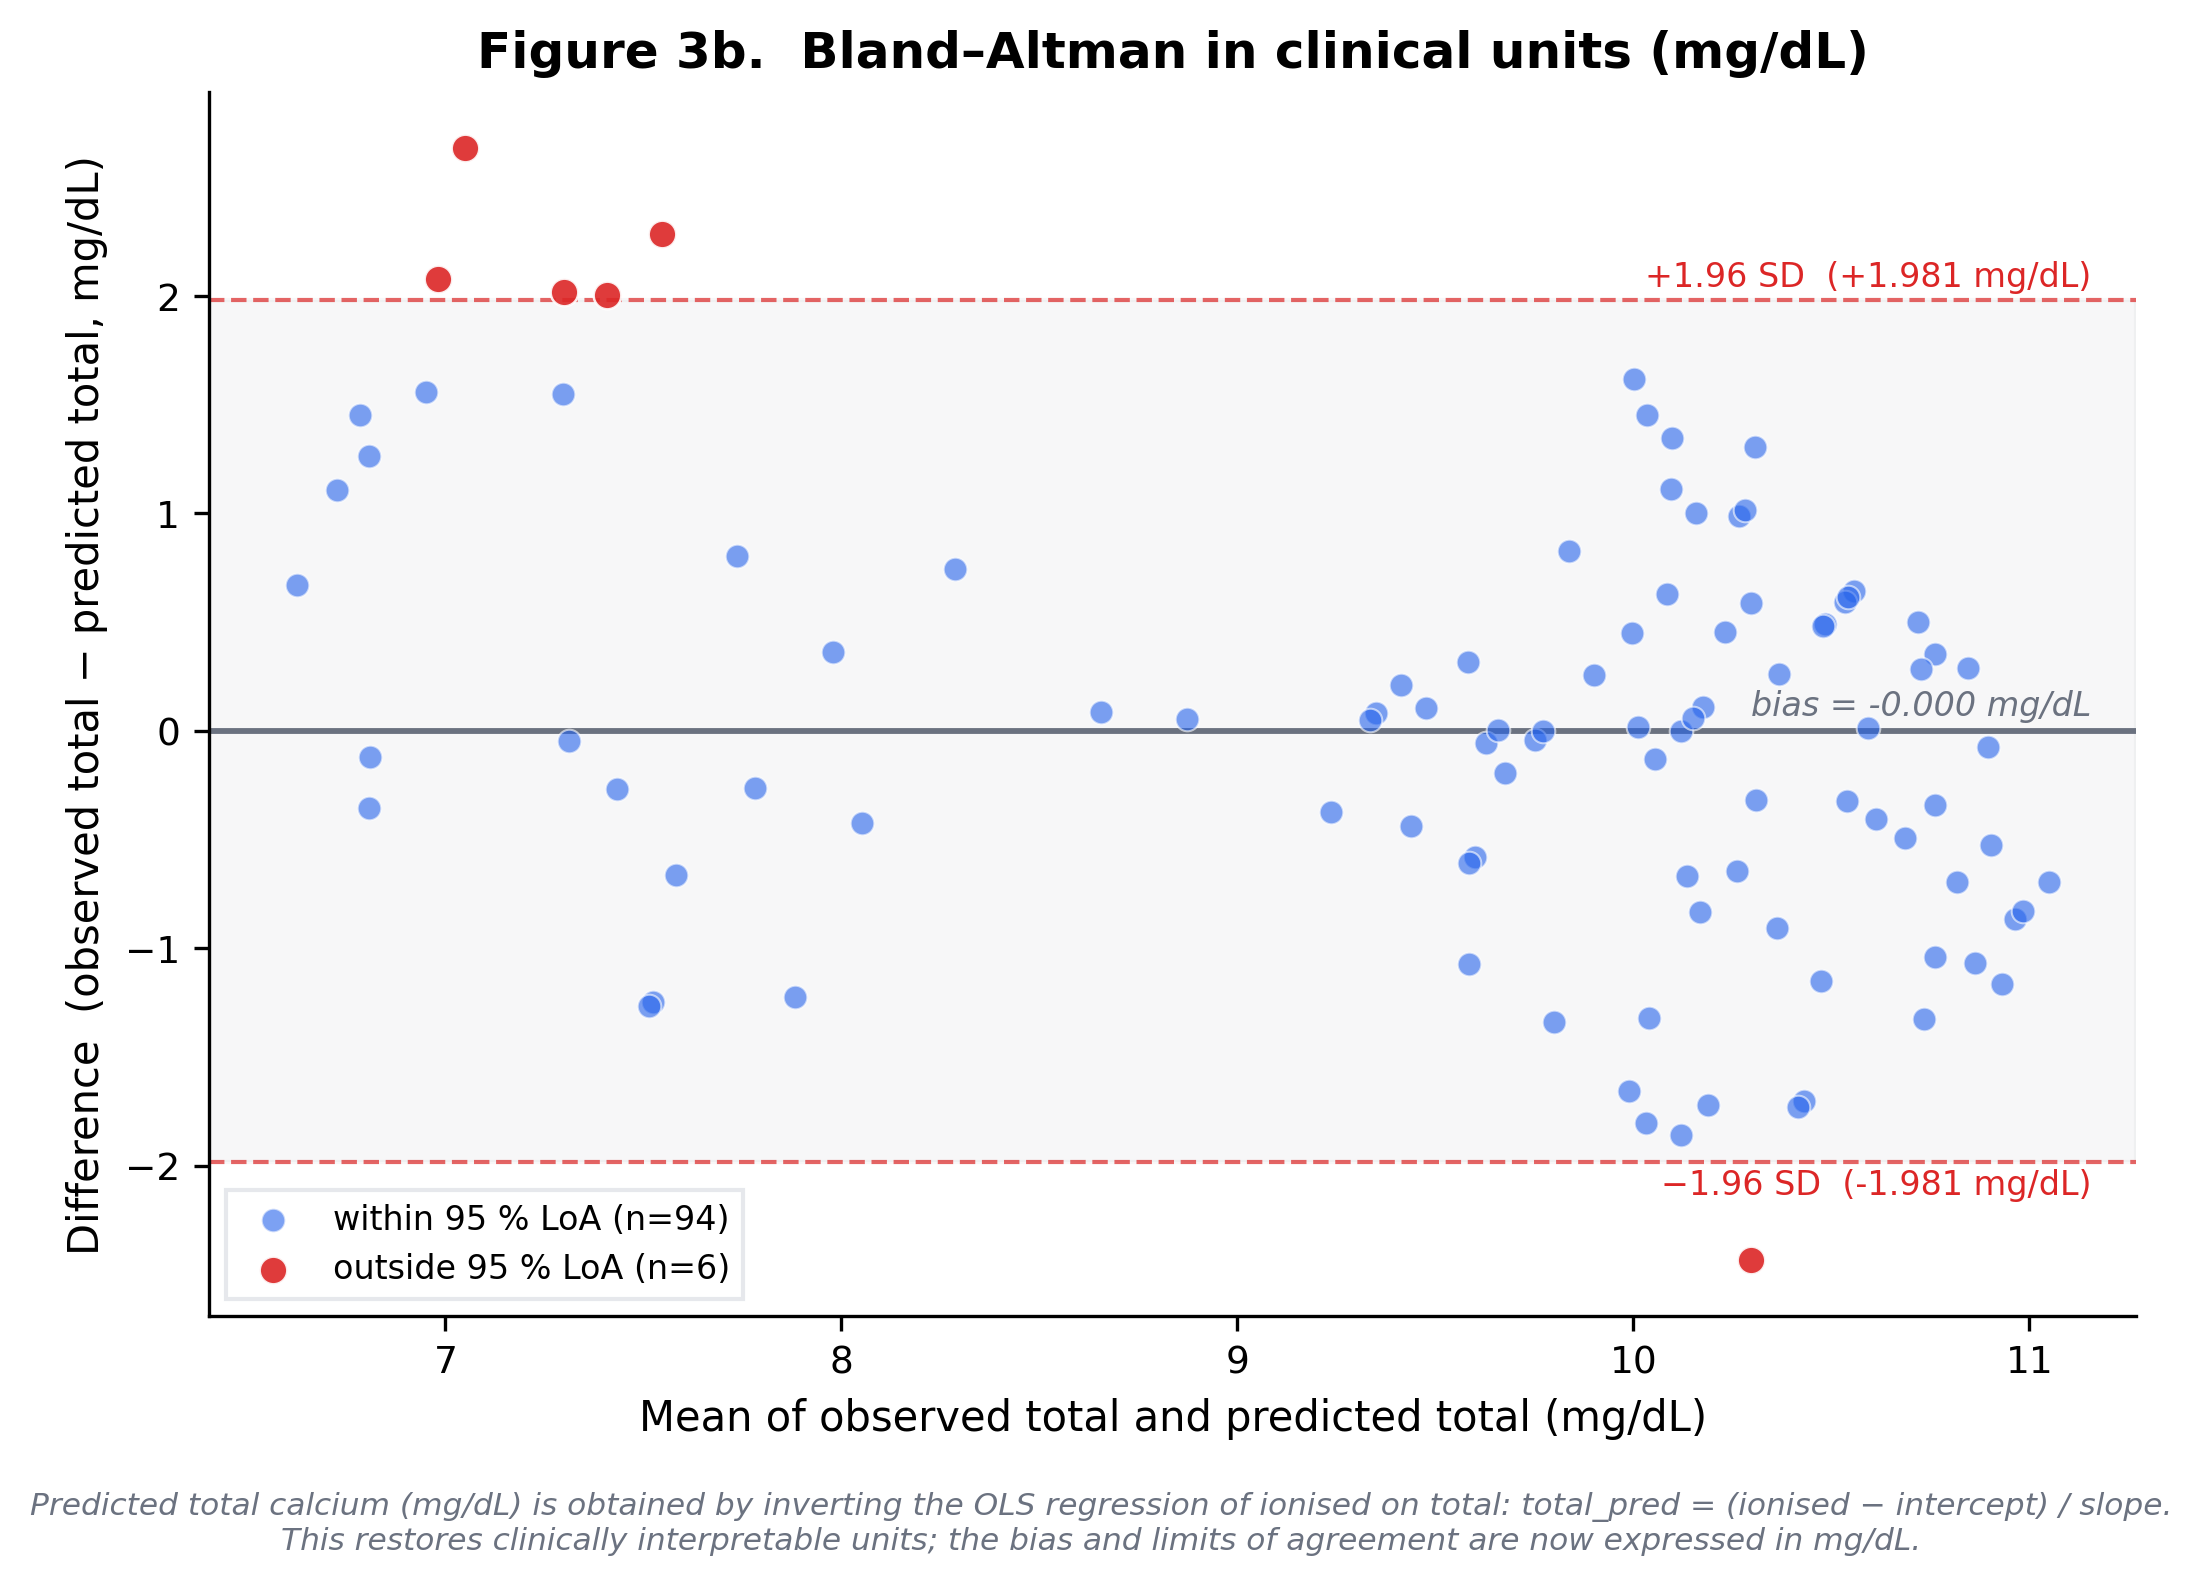
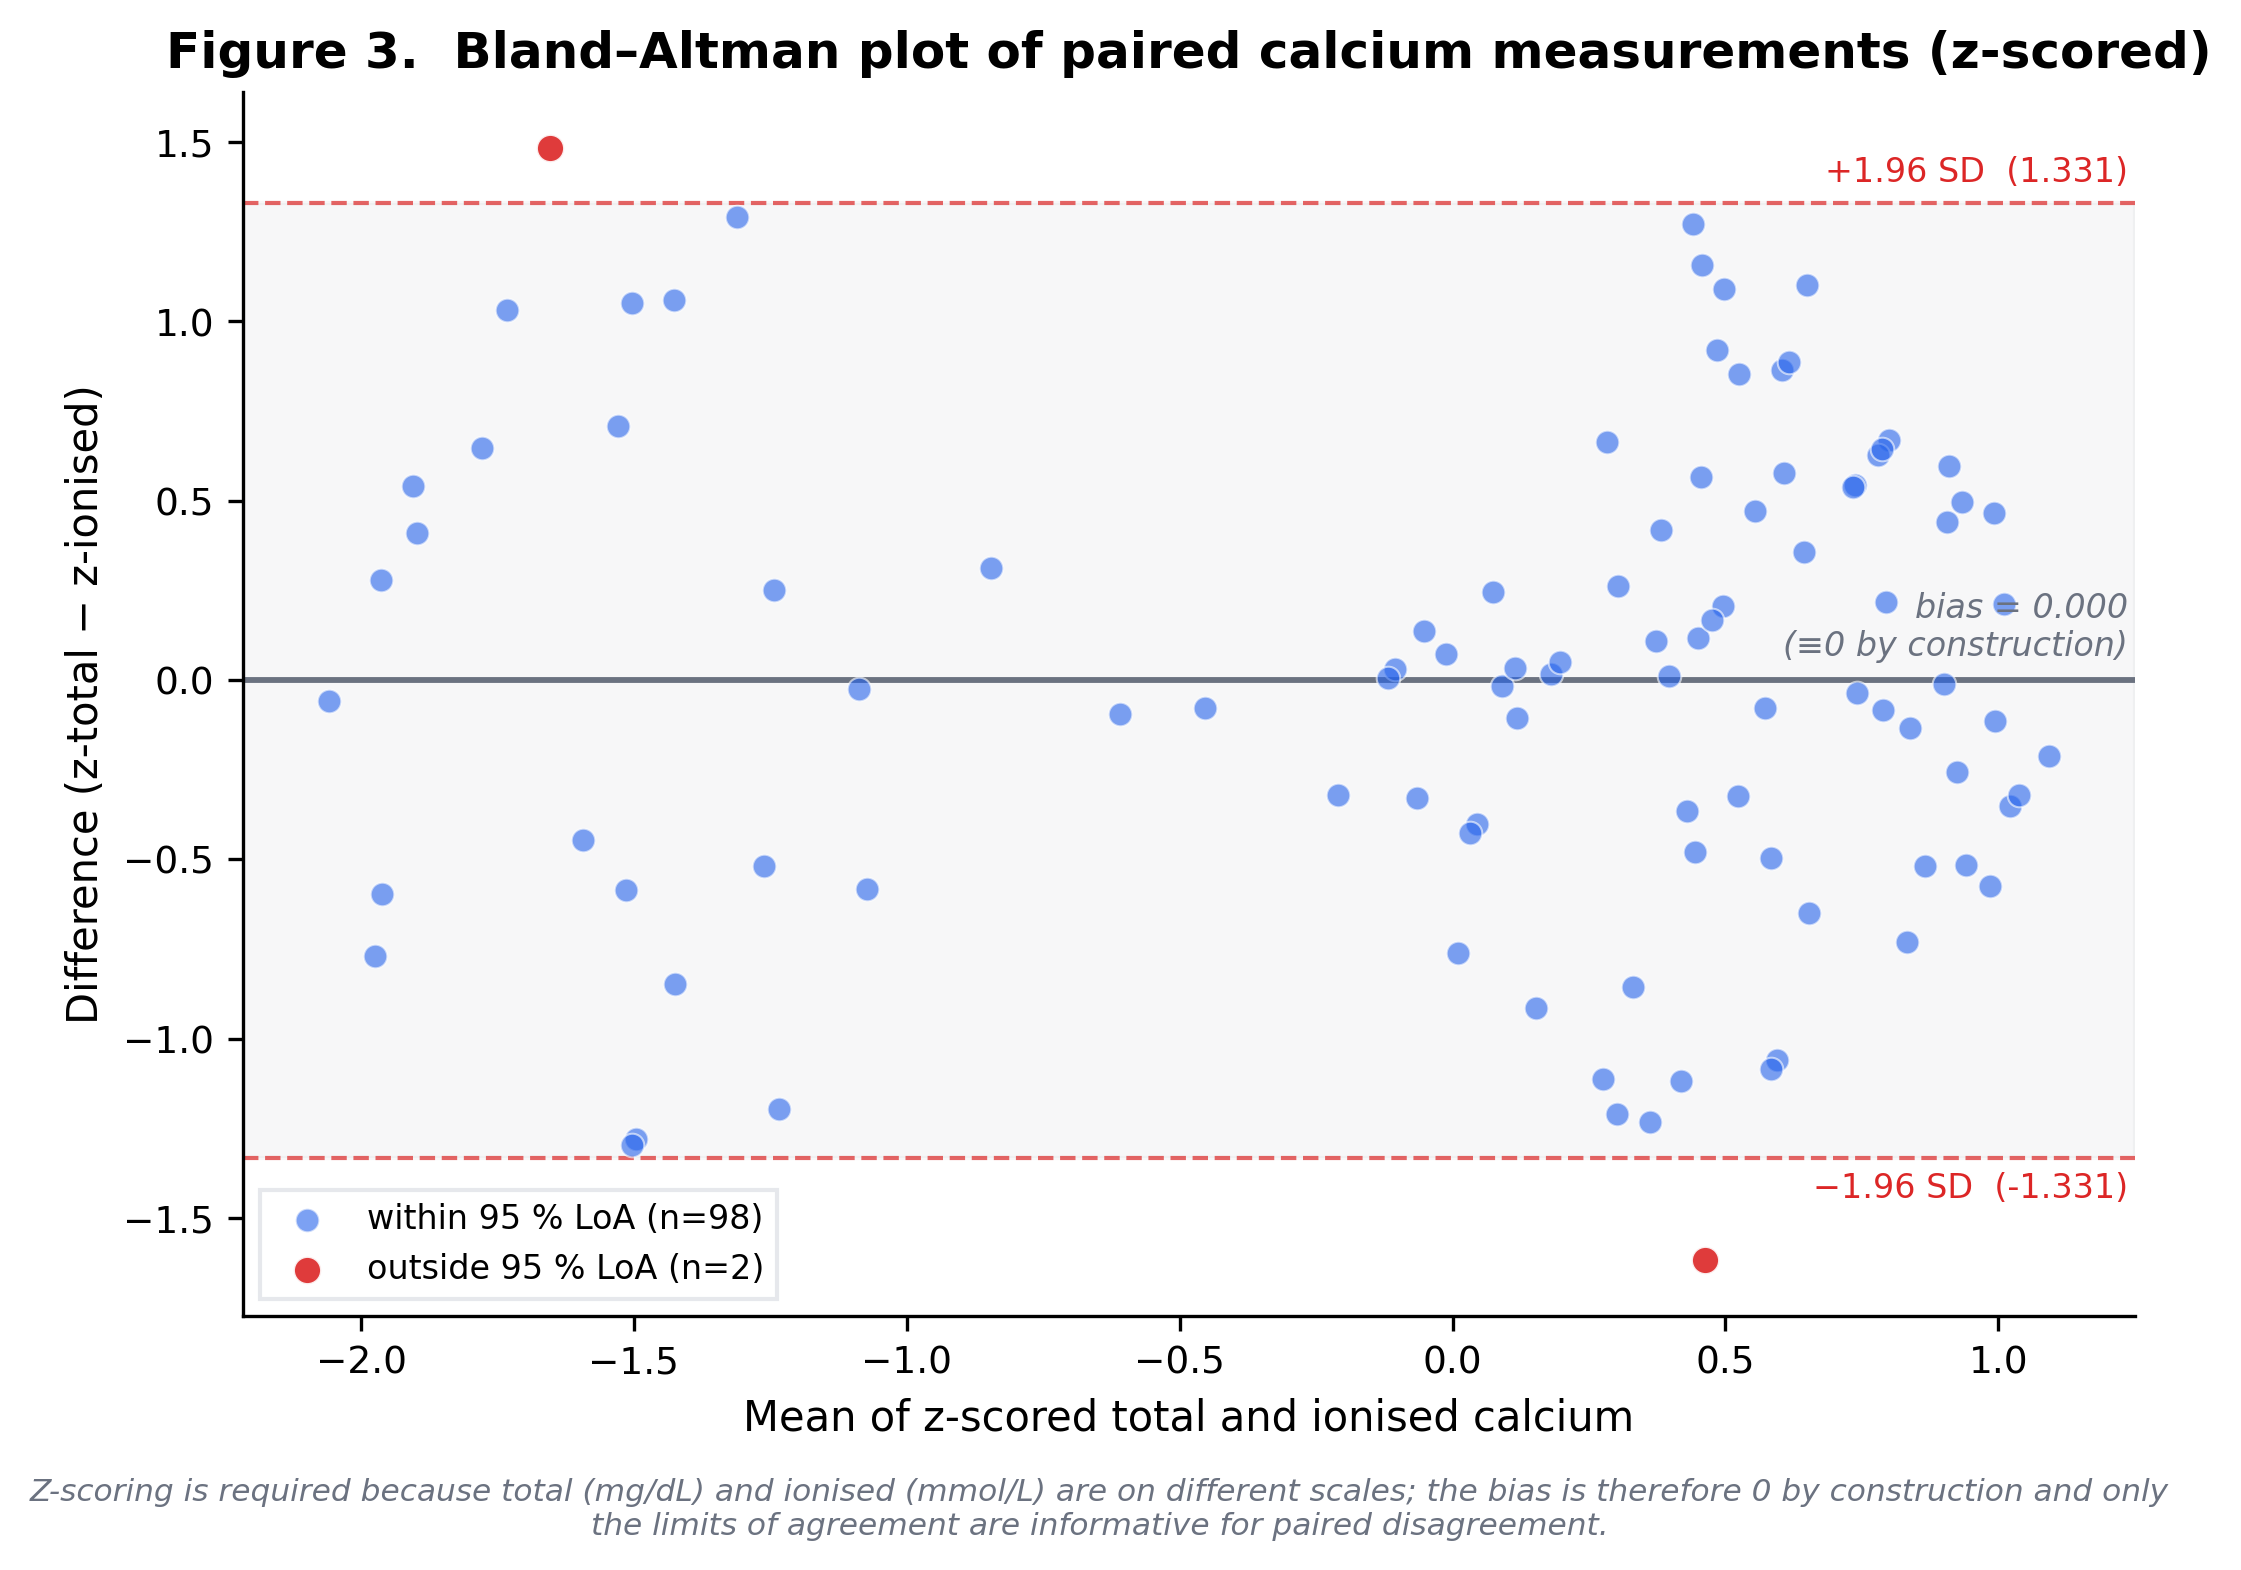
Reference-range comparison
The ionised calcium distribution, but not total calcium, differed from the published paediatric reference midpoint after BH-FDR correction: Wilcoxon signed-rank differs from paediatric reference midpoint (p = 0.0, q-FDR = 0.0); 26.0% below reference, 0.0% above. The in-range, below-range, and above-range counts are shown in Table 2.
Age-only prediction
Age alone did not discriminate hypocalcaemia by either laboratory definition. For total-calcium hypocalcaemia, the age-only total-calcium model had CV-AUC = 0.472 (in-sample 0.5304, optimism 0.0584). For ionised-calcium hypocalcaemia, the age-only ionised-calcium model had CV-AUC = 0.5327 (in-sample 0.5372, optimism 0.0044). Both models remained below the pre-specified CV-AUC threshold (≥0.65) and are therefore reported descriptively only. Figure 4 shows the age-stratified prevalence context rather than a prediction curve.
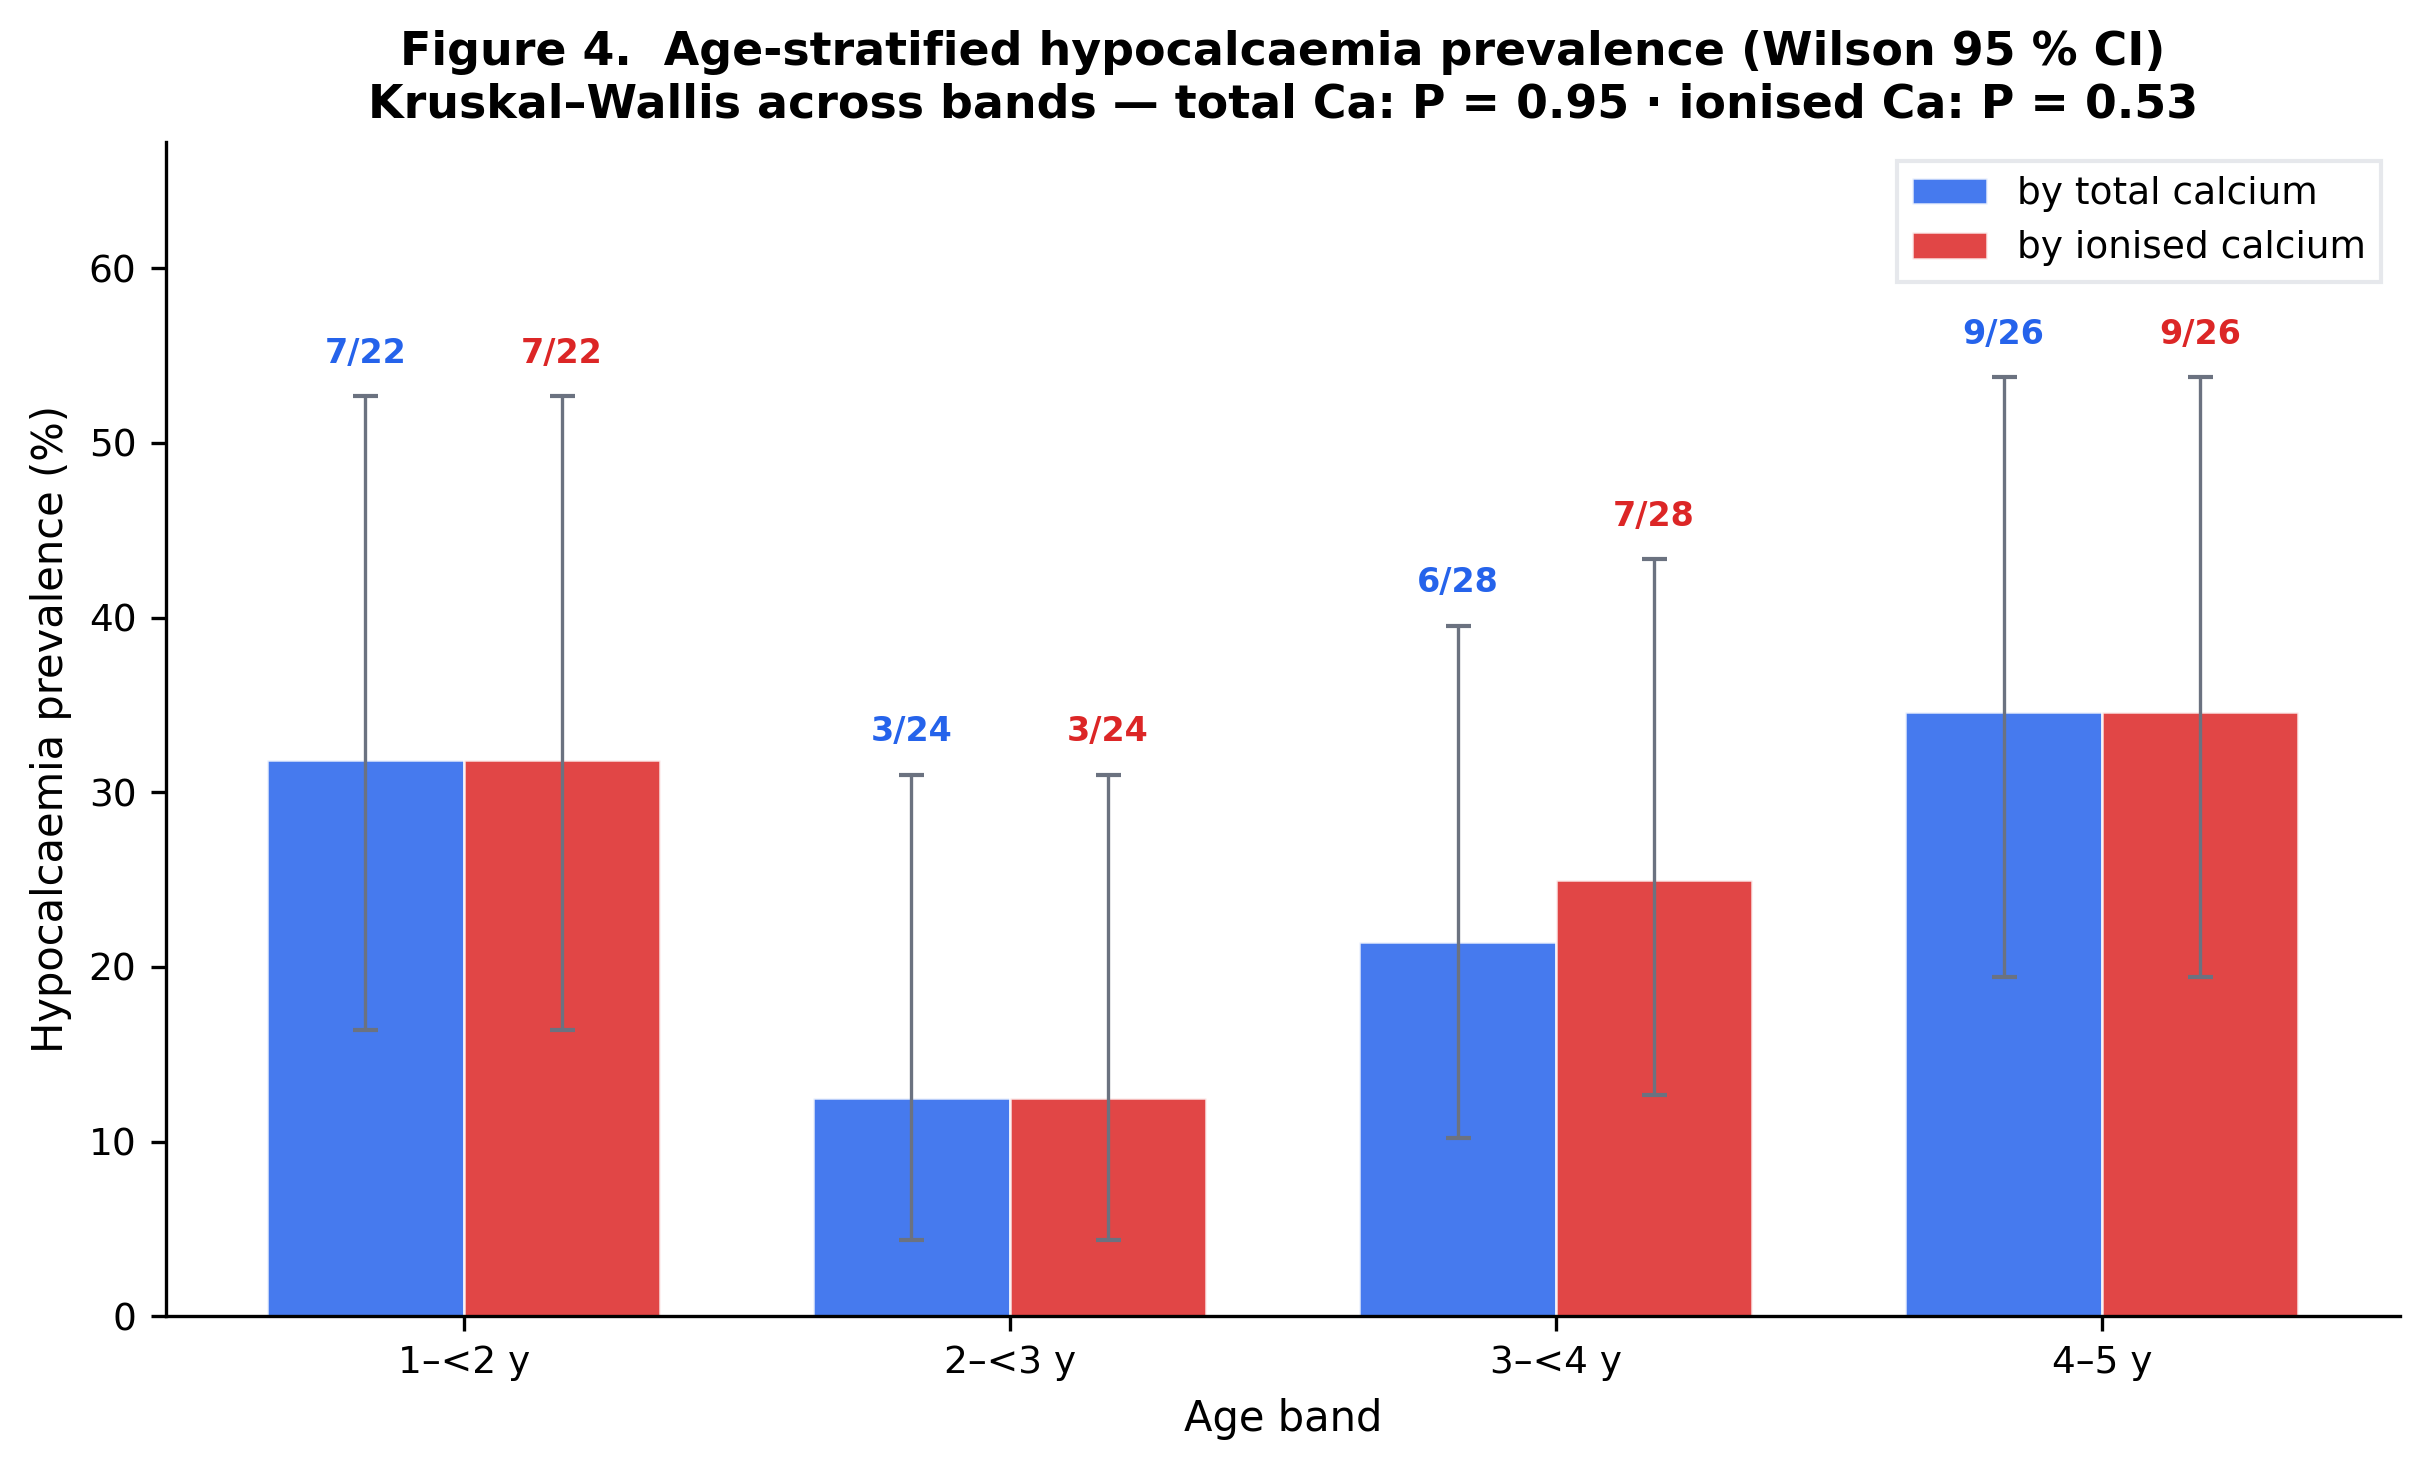
Discussion
We interpret these findings in relation to measurement validity, existing paediatric literature, and the limits of this cohort.
Principal findings
On this synthetic paediatric cohort, hypocalcaemia by either laboratory definition affected approximately one in four patients, the two definitions classified essentially the same patients (Cohen's κ ≈ 0.97, observed agreement 0.99), and the continuous correlation was strong but imperfect (Pearson r ≈ 0.77, R² ≈ 0.59). Ionised calcium values skewed below the published paediatric reference centre, while total calcium did not. The pre-specified logistic regression on age was a deliberate negative finding: neither model crossed the CV-AUC ≥ 0.65 deployment threshold. Together, these findings separate two questions that are often conflated in clinical datasets: whether total calcium can identify the same low-calcium cases as ionised calcium, and whether it can quantify calcium status with the same precision.
Relation to existing evidence
The retrieved paediatric literature supports cautious interpretation rather than direct generalisation. It includes reports on hypocalcaemia in respiratory infection, paediatric reference intervals, and the practical distinction between total and ionised calcium measurement ([1], [2], [3], [4], [5], [6], [7], [8], [9]). Additional retrieved records address the clinical context of hypocalcaemia and age-related calcium variation ([2], [3], [10], [11], [12], [13]). Those studies provide biological and measurement context for this analysis, but they do not replace validation in an external LRTI cohort. For that reason, the present manuscript treats the literature as context for interpretation while keeping every numerical result tied to the analysed cohort.
Interpretation
The near-perfect binary concordance suggests that, in this dataset, total calcium and ionised calcium identified nearly the same patients as hypocalcaemic. That result should not be read as proof that the assays are interchangeable on the continuous scale. The correlation and Bland-Altman analyses showed substantial residual variation, meaning total calcium may be adequate for case-finding in this narrow setting while remaining inadequate as a quantitative substitute for ionised calcium. The age-only logistic models add a second boundary: age within the 1-5 year window did not provide enough discrimination to support prediction.
Limitations
This analysis has important limitations. The dataset contains 100 records and all estimates therefore have limited precision. The cohort does not include albumin, pH, vitamin D, magnesium, phosphate, inflammatory markers, severity scores, treatment, or clinical outcomes; these omissions prevent causal or prognostic inference. Ionised calcium thresholds are also analyser- and pH-dependent, so the chosen threshold should be treated as an analysis definition rather than a universal clinical cut-off. Finally, the reference-range comparison tests departure from the reference midpoint; the below-range counts are reported separately and should not be conflated with that one-sample test.
Clinical implications and next study
The immediate implication is narrow but useful: this cohort supports total calcium as a potential binary screen for hypocalcaemia, not as a continuous replacement for ionised calcium. A definitive study should repeat the same analysis in a real, prospectively defined paediatric LRTI cohort with paired total and ionised calcium, albumin, pH, vitamin D, magnesium, phosphate, severity markers, and clinical outcomes. Only that design can test whether the observed concordance persists and whether any biochemical marker predicts clinically meaningful deterioration.
Conclusion
In this 100-record synthetic paediatric LRTI dataset, the two laboratory definitions of hypocalcaemia produced almost identical case lists (κ ≈ 0.97), but the continuous relationship between total and ionised calcium retained ≈ 41 % unexplained variance — interchangeability for case-finding does not imply interchangeability for quantification. Age alone did not discriminate hypocalcaemia and the pre-specified logistic models were demoted by the CV-AUC ≥ 0.65 deployment gate. These findings are hypothesis-generating; prospective validation in a real paediatric LRTI cohort is required before any clinical deployment.
Declarations
Ethical considerations
No human subjects research was performed: the dataset is a synthetic teaching artefact and contains no real patient records. Institutional review board approval was therefore neither sought nor required.
Availability of data and materials
The synthetic dataset, the analysis code, and the analysis configuration are publicly available at https://research.medtwin.ai/reports/lrti-calcium/.
Competing interests
The authors declare no competing interests.
Funding
No external funding was received for this work.
Acknowledgements
The authors thank the clinical staff who contributed to data collection. Statistical analyses were performed in Python (scipy, statsmodels, scikit-learn, pandas).
Submission checklist (author-facing appendix)
_The items below are routinely required by paediatric journals and are listed here as placeholders for the human author team to complete before submission._
Authors and affiliations
[TO BE FINALISED] List each author with ORCID iD and affiliation.
Author contributions (CRediT)
[TO BE FINALISED] Conceptualisation, Data curation, Formal analysis, Investigation, Methodology, Project administration, Software, Supervision, Validation, Visualisation, Writing — original draft, Writing — review & editing.
Ethics approval
[TO BE FINALISED] No human subjects research was conducted on this synthetic dataset; for any future application to real cohort data, IRB approval and consent waiver references must be added here.
Consent for publication
[TO BE FINALISED] Not applicable — synthetic dataset only.
Trial registration
[TO BE FINALISED] Not applicable — observational analysis.
Supplementary material
Supplementary Tables
Supplementary Table S1. Per-patient cohort listing (raw/lrti_data.json, n = 100).
Supplementary Table S2. Per-stage manuscript build trace (MANUSCRIPT_BUILD_TRACE.md and the 14 staged artefacts in staged/).
Supplementary Table S3. Concept-graph triple listing (raw/concept_graph.json, 98 edges across 25 papers).
Supplementary Figures
Supplementary Figure S1. Bland–Altman plot of paired total and ionised calcium values after z-score standardisation; by construction the mean bias is zero and only the spread of the limits of agreement is empirically informative.
References
- Puneem US, Nagasubramanian VR, Sridevi B, et al. Prevalence of Hypocalcemia in Pediatrics With Lower Respiratory Tract Infections. Clin Pediatr (Phila). 2025;64(8):1138-1143. doi:10.1177/00099228251321916. PMID: 40008601.
- Chisti MJ, Duke T, Salam MA, et al. Impact of Diarrhea on the Clinical Presentation and Outcome of Severe Pneumonia in Bangladeshi Children. Pediatr Infect Dis J. 2016;35(10):1161-2. doi:10.1097/INF.0000000000001265. PMID: 27314825.
- Oduwole AO, Renner JK, Disu E, Ibitoye E, Emokpae E. Relationship between vitamin D levels and outcome of pneumonia in children. West Afr J Med. 2010;29(6):373-8. doi:10.4314/wajm.v29i6.68261. PMID: 21465443.
- Omosule CL, Holmes V, Jasek C, Roper SM. Pediatric ionized calcium reference intervals from archived radiometer data. Clin Biochem. 2022;104:13-18. doi:10.1016/j.clinbiochem.2022.03.001. PMID: 35288108.
- Faarvang AA, Rosengren TS, Pedersen LE, Larsen PB, Jensen EA. Reference ranges for ionized calcium in plasma in Danish children aged 0 days to 3 years using laboratory registry data. Clin Chem Lab Med. 2025;63(11):2304-2309. doi:10.1515/cclm-2025-0353. PMID: 40785088.
- Abdollahian N, Ghazizadeh H, Mohammadi-Bajgiran M, et al. Age-specific reference intervals for routine biochemical parameters in healthy neonates, infants, and young children in Iran. J Cell Mol Med. 2023;27(1):158-162. doi:10.1111/jcmm.17646. PMID: 36524863.
- Dabla PK, Sharma S, Dabas A, et al. Ionized Blood Magnesium in Sick Children: An Overlooked Electrolyte. J Trop Pediatr. 2022;68(2). doi:10.1093/tropej/fmac022. PMID: 35265997.
- Ayulo M, Katyal C, Agarwal C, et al. The prevalence of vitamin D deficiency and its relationship with disease severity in an urban pediatric critical care unit. Endocr Regul. 2014;48(2):69-76. doi:10.4149/endo_2014_02_69. PMID: 24824802.
- El Razaky O, Naeem A, Donia A, El Amrousy D, Elfeky N. Cardiac changes in moderately malnourished children and their correlations with anthropometric and electrolyte changes. Echocardiography. 2017;34(11):1674-1679. doi:10.1111/echo.13692. PMID: 28895173.
- Dias CRB, Leite HP, Nogueira PCK, Brunow de Carvalho W. Ionized hypocalcemia is an early event and is associated with organ dysfunction in children admitted to the intensive care unit. J Crit Care. 2013;28(5):810-5. doi:10.1016/j.jcrc.2013.03.019. PMID: 23683566.
- Abrams SA. Selected Micronutrient Needs of Children 1-3 Years of Age. Nestle Nutr Inst Workshop Ser. 2020;95:67-77. doi:10.1159/000511507. PMID: 33147581.
- Sümpelmann R, Mader T, Eich C, Witt L, Osthaus WA. A novel isotonic-balanced electrolyte solution with 1% glucose for intraoperative fluid therapy in children: results of a prospective multicentre observational post-authorization safety study (PASS). Paediatr Anaesth. 2010;20(11):977-81. doi:10.1111/j.1460-9592.2010.03428.x. PMID: 20964764.
- Drożdż D, Kwinta P, Sztefko K, et al. [Do we successfully treat anemia and calcium-phosphate disorders in children with chronic kidney disease at the beginning of the twenty-first century?]. Przegl Lek. 2015;72(7):349-53. PMID: 26817347.
Downloads
- MANUSCRIPT_PUBLICATION.md — journal-ready (markdown)
- MANUSCRIPT_PUBLICATION.docx — journal-ready (Word, with embedded figures)
- MANUSCRIPT_PUBLICATION.html — standalone HTML preview (figures inlined as base64; opens directly in any browser)
- COVER_LETTER_BMC_Pediatrics.md — submission cover letter (BMC Pediatrics)
- SUPPLEMENT_STROBE_checklist.md — completed STROBE 22-item checklist
- JOURNAL_SUBMISSION_GUIDE.md — pre-flight checklist + backup target journals
- MANUSCRIPT_DRAFT.md — staged build artefact, not reader-facing prose
- Manuscript.docx — staged build artefact (Word)
- STATISTICAL_RESULTS.md — machine-readable summary
Verification pipeline (4-layer hallucination guard)
schema, types, refs] B --> C[L2: Abstract-shape
section IDs, [PMID:N] tokens] C --> D[L2.5: Triple grounding
verbatim abstract substring] D --> E[L3: LLM critic
semantic plausibility] E --> F[Manuscript accepted] D -->|fail| X[excise_unsupported.py
self-heal flagged sentences] X --> C style F fill:#d1fae5,stroke:#065f46 style X fill:#fee2e2,stroke:#991b1b
In-Browser Python Sandbox
Re-run the analysis in your browser via Pyodide; the full results JSON is loaded as `_data`.
Pyodide playground
# Full results JSON is available as `_data` (a Python dict).
import json
print('Top-level keys:', list(_data.keys()))
print()
print('Headline findings:')
for f in _data.get('headline_findings', {}).get('findings', []):
    print(f"  [{f['rank']}] [{f['strength']:8s}] {f['claim']}")
Recompute prevalence
import pandas as pd
from scipy import stats
from statsmodels.stats.proportion import proportion_confint

thr = _data['meta']['config_snapshot']['hypocalcemia_thresholds']
pairs = _data['section_e'].get('scatter_pairs', [])
df = pd.DataFrame(pairs)
if len(df):
    n = len(df)
    n_low = int((df['total'] < thr['ca_total_mg_dl']).sum())
    lo, hi = proportion_confint(n_low, n, alpha=0.05, method='wilson')
    print(f'Hypocalcaemia (total Ca): {n_low}/{n} = {n_low/n*100:.1f}% (95% CI {lo*100:.1f}-{hi*100:.1f}%)')
Limitations
Design and measurement constraints inherent to a small single-centre audit.
Hard limits of this audit
- Single-centre. Patients are drawn from one institution; case-mix, referral patterns and laboratory technique may not generalise.
- No comparator. 100% of patients have LRTI; we cannot benchmark against healthy controls or alternate diagnoses to attribute findings to infection per se.
- No outcome variables. No length of stay, oxygen requirement, mortality or severity score. The "derived outcome" hypocalcaemia is a lab threshold, not a clinical event.
- Cross-sectional snapshot. No longitudinal calcium trajectory; no supplementation effect; no recovery dynamics.
- n = 100. Age-band subgroups (~25/band) have wide CIs; null findings (notably the age-prediction logistic) are underpowered to exclude small effects.
- No albumin / vitamin D / magnesium / PTH. Total Ca cannot be albumin-corrected; the aetiology of any hypocalcaemia (nutritional, parathyroid, inflammatory) cannot be adjudicated.
- No pre-analytical variables. Tourniquet time, sample handling, pH and time-from-draw are uncaptured. Ionised calcium is particularly sensitive to these factors.